Opsgenie を Hosted Graphite と統合する
Opsgenie が Hosted Graphite ユーザーに提供するもの
Opsgenie の Hosted Graphite インテグレーション を使用して、Hosted Graphite アラートを Opsgenie に転送します。Opsgenie は、オンコール スケジュールに基づいて通知する適切な担当者を決定します。メール、テキスト メッセージ (SMS)、電話、iOS、Android のプッシュ通知によって通知し、アラートが確認されるかクローズされるまでアラートをエスカレートします。
統合の機能性
アラートが Hosted Graphite で作成されると、Opsgenie でも作成されます。
Opsgenie で Hosted Graphite インテグレーションを追加する
Opsgenie の Free プランまたは Essentials プランを使用している、または Jira Service Management の Standard プランで Opsgenie を使用している場合は、チーム ダッシュボードからのみこの統合を追加できます。 このプランでは、[設定] の [統合] ページが利用できません。
[チーム] に移動して自分のチームを選択します。
左側のナビゲーションで [統合] を選択し、[統合を追加] を選択します。
統合をチーム ダッシュボードから追加すると、そのチーム統合の所有者になります。Opsgenie では、この統合を通じて受信したアラートはそのチームのみに割り当てられます。このセクションの残りの手順に従って、統合を設定してください。
[設定] > [統合] の順に移動します。「Hosted Graphite」を検索して、[追加] を選択します。
[応答者] フィールドを使用して Hosted Graphite アラートの通知先を指定します。入力し始めると、オートコンプリートの候補が表示されます。
API キーをコピーします。
[Save Integration (統合の保存)] を選択します。
Hosted Graphite での設定
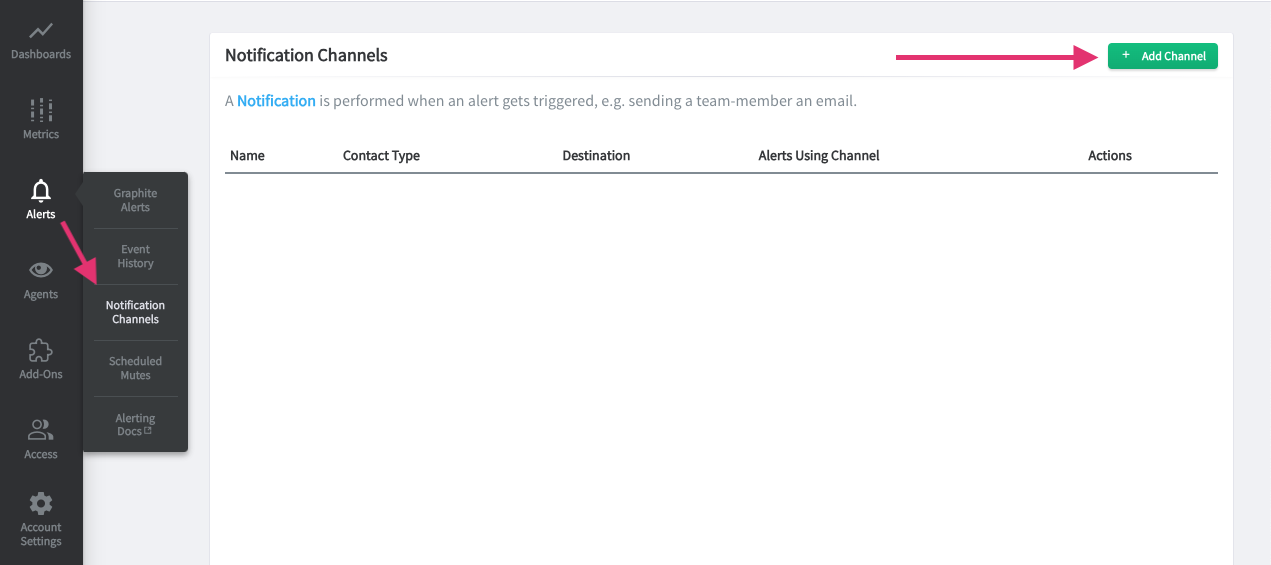
In Hosted Graphite, go to Notification Channels.
[+ チャンネルを追加] をクリックします。
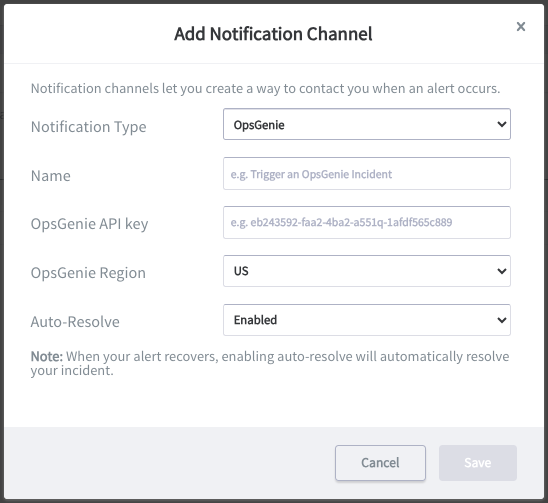
3. [通知タイプ] から [Opsgenie] オプションを選択します。
4. 通知チャンネルの名前を [名前] フィールドに入力します。
5. Opsgenie からコピーした API キーを [Opsgenie API キー] に貼り付けます。
6. [保存] をクリックします。
Hosted Graphite から送信されるペイロードの例
アラートのペイロードを作成します。
JSON
{
    "name": "hostedgraphite_test_alert",
    "criteria": "metric values missing for 1 minutes",
    "graph": "http://i.mfhg.io/render-api/e3c33750/035359b9aefe772.png",
    "value": "None",
    "metric": "_test-data.servers.webserver0.requests.count",
    "status": "alerting",
    "backoff_minutes": false,
    "info": "Instructions regarding the alert"
}
このペイロードは Opsgenie によって次のように解析されます。
JSON
{
    "alarmName": "test",
    "alarmCriteria": "metric values missing for 1 minutes",
    "alarmValue": "None",
    "alarmMetric": "_test-data.servers.webserver0.requests.count",
    "alarmStatus": "alerting",
    "alarmInfo": "Instructions regarding the alert"
}
アラートのペイロードをクローズします。
JSON
{
    "name": "hostedgraphite_test_alert",
    "criteria": "metric values missing for 1 minutes",
    "graph": "http://i.mfhg.io/render-api/e3c33750/035359b9aefe772.png",
    "value": "None",
    "metric": "_test-data.servers.webserver0.requests.count",
    "status": "recovered",
    "backoff_minutes": false,
    "info": "Instructions regarding the alert"
}
このペイロードは Opsgenie によって次のように解析されます。
JSON
{
    "alarmName": "test",
    "alarmCriteria": "metric values missing for 1 minutes",
    "alarmValue": "None",
    "alarmMetric": "_test-data.servers.webserver0.requests.count",
    "alarmStatus": "recovered",
    "alarmInfo": "Instructions regarding the alert"
}
この内容はお役に立ちましたか?