Act on insights from mission control
The mission control center is available to Confluence admins with a Premium or Enterprise plan.
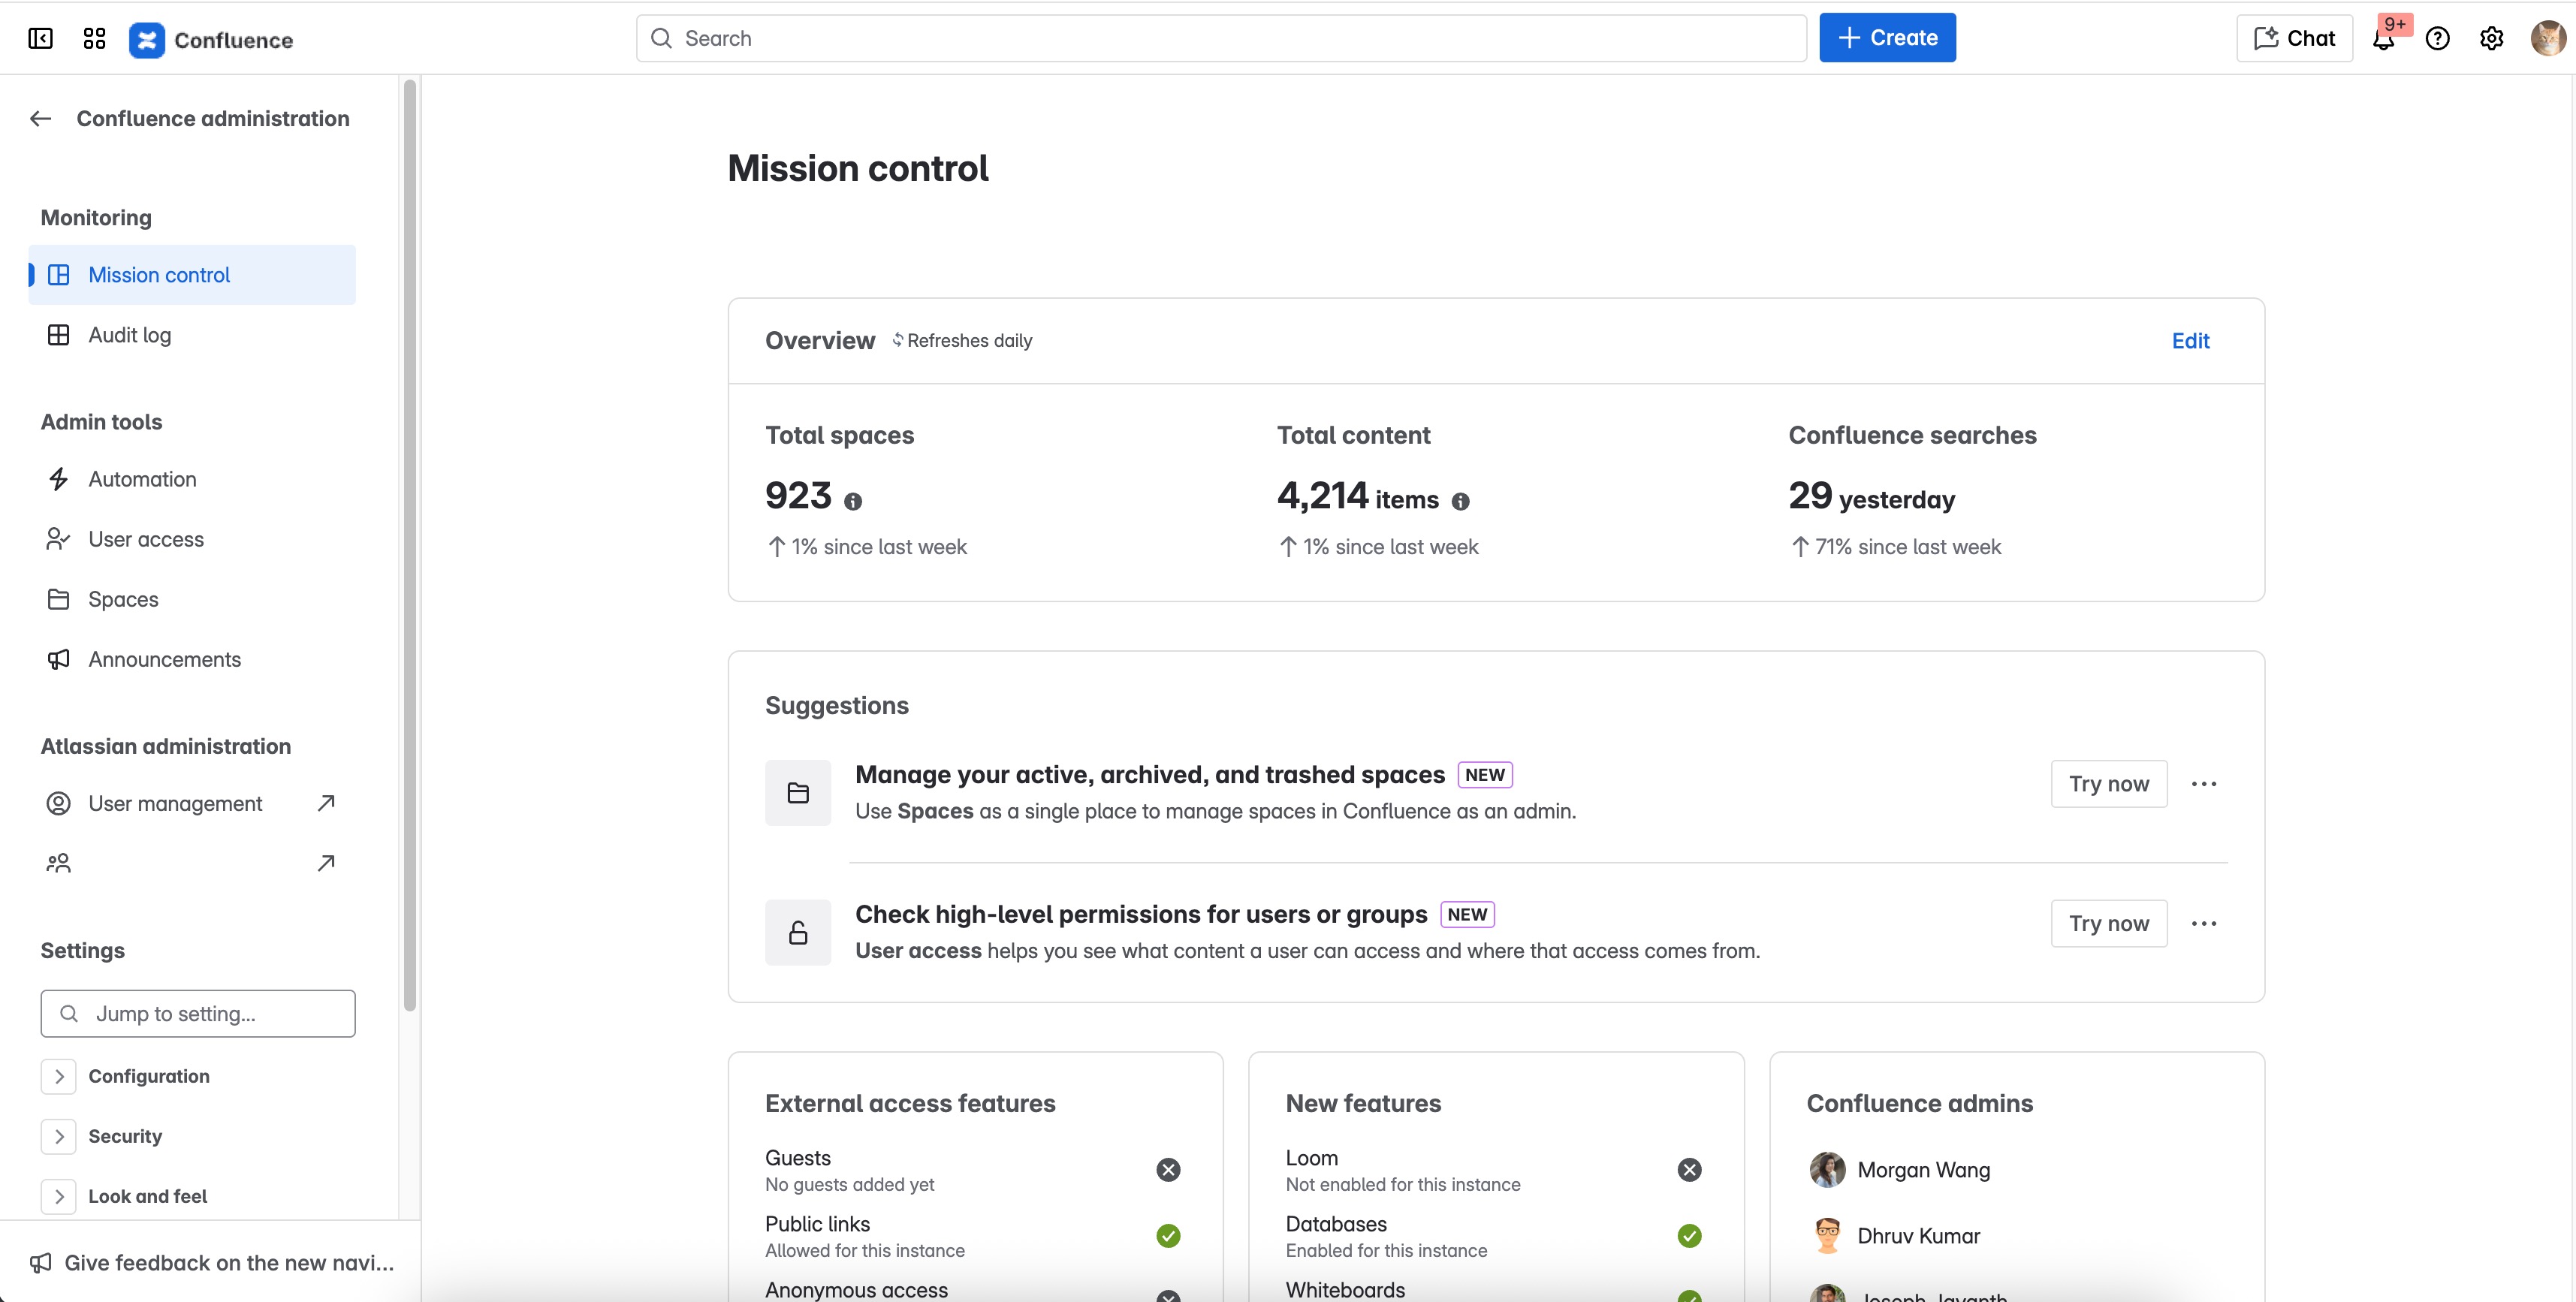
Confluence administrators with a Premium or Enterprise plan have a mission control center to keep them aligned, informed, and proactive while overseeing global activity.
When they select Confluence administration this is the first place they’ll land — a hub that provides better visibility and a big-picture view of what’s happening across Confluence. With key notifications, metrics, and analytics-based insights, Confluence admins can:
Establish a baseline of normal activity so it’s more obvious if something is wrong
Know how much content they have, who owns it, who can access it, and if it's being updated
Easily locate and access the administrative tools and controls that help them take action
When Confluence administrators with Standard or Free plans select Confluence administration, they will land in General configuration under settings.
They’ll see mission control in their side navigation, but will need to start a Confluence Premium trial in order to use it.
Alerts
If something needs the immediate attention of an administrator, it gets surfaced as a blue alert at the top of the page. For example, if there are guest users waiting to be assigned to a space. Once any Confluence administrator completes the action, the alert will disappear.
Metrics
Next there’s a row of high-level metrics. Metrics data are refreshed approximately every 24 hours. This is where Confluence administrators can see any unusual spikes in recent activity.
Total spaces
The total number of spaces (“All spaces”), including personal spaces, that exist in the Confluence space directory as of the most recent refresh.
This won’t include archived or trashed spaces.
Total content
The total number of pages, live docs, blogs, whiteboards, and databases that exist in the content tree as of the most recent refresh.
Confluence searches
The total number of searches that were conducted the day before via Confluence quick search, advanced search, and/or Ask AI.
Summary cards
Summary cards surface when optional features are enabled and who has administrative access. Features that are on will have a green check mark. Features that are off will have a gray cross mark.
External access features card
External access features are powerful tools for collaboration and sharing, and we want admins to feel confident they are aware when these features are enabled. The External access features card lists all the available features that could open the instance to unlicensed users, including the general public. Manage global permissions leads directly to where these can be turned on or off.
This card is always visible.
Beta features card
The Beta features contains new features that Confluence is actively beta-testing with an open opt-in. This won’t include features that are part of closed testing, like our early access programs. Manage beta features leads to the New features setting to learn more about opting in.
This card is only visible when there are open beta programs available.
Confluence admins card
The Confluence admins card is a consolidated list of everyone who has Confluence administrator privileges in the instance. If someone also has organization admin privileges, they’ll be identified with a lozenge beside their name. This provides an appropriate point of contact regarding user or billing questions.
This card is always visible.
Dashboards
Dashboards take the analytics available to all Confluence users (when enabled), and synthesizes them into actionable areas of focus for Confluence admins. We’re continually reviewing customer feedback to add and revise the most valuable data points, but here are some examples of what you might see. Dashboard views can be changed by selecting different time frames from the dropdowns.
Was this helpful?