Opsgenie を Splunk IT Service Intelligence と統合する
Splunk ITSI には、アラートを作成したり、スクリプトをトリガーしたりするための、重要なイベント機能があります。Splunk ITSI アラートを使用して、特定のイベントを監視し、それに応答します。アラートは、保存された検索を使用して、リアルタイムまたはスケジュールに従ってイベントを検索します。検索結果が特定の条件を満たすと、アラートがトリガーされます。アラート アクションは、アラートがトリガーされたときに応答するために使用できます。
Opsgenie は Splunk ITSI ユーザーに何を提供しますか?
Splunk IT Service Intelligence は、優先順位に基づいてフィルタリングしてソートすることで、膨大なイベントを簡単に選別できます。さらに、Splunk ITSI はアラートをトリガーして、修復を開始し、インシデント ワークフローを自動化します。リアルタイム異常検出により、アラートによる疲弊も軽減されます。Splunk ITSI アプリの Opsgenie を通じて、Splunk ITSI アラートを Opsgenie に転送します。Splunk ITSI インテグレーションによって、Opsgenie はこれらのアラートのディスパッチャーとして機能し、オンコール スケジュールに基づいて通知する適切な担当者を決定します。メール、テキスト メッセージ (SMS)、電話、iPhone と Android のプッシュ通知によって通知し、アラートが確認されるかクローズされるまでアラートをエスカレートします。
統合の機能性
Opsgenie には Splunk ITSI 固有のアラート アプリがあり、Splunk ITSI アラートを Opsgenie に送信します。Opsgenie には Splunk ITSI インテグレーション固有の API もあり、Splunk ITSI は Splunk ITSI 用 Opsgenie アプリを介してアラートを Opsgenie に送信します。Opsgenie はアラートの自動作成を処理します。
Opsgenie で Splunk ITSI インテグレーションを追加する
Opsgenie の Free プランまたは Essentials プランを使用している、または Jira Service Management の Standard プランで Opsgenie を使用している場合は、チーム ダッシュボードからのみこの統合を追加できます。 このプランでは、[設定] の [統合] ページが利用できません。
[チーム] に移動して自分のチームを選択します。
左側のナビゲーションで [統合] を選択し、[統合を追加] を選択します。
統合をチーム ダッシュボードから追加すると、そのチーム統合の所有者になります。Opsgenie では、この統合を通じて受信したアラートはそのチームのみに割り当てられます。このセクションの残りの手順に従って、統合を設定してください。
[設定] > [統合] の順に移動します。Splunk ITSI を検索して [追加] を選択します。
[応答者] フィールドを使用して、Splunk アラートの通知先を指定します。入力し始めると、オートコンプリートの候補が表示されます。
API URL をコピーします。
[Save Integration (統合の保存)] を選択します。
Splunk ITSI での設定
Splunk で、Splunkbase から Splunk ITSI アプリの Opsgenie をインストールします。
2. インストール後、[設定]-[アラート アクション] に移動し、[Splunk ITSI 用に Opsgenie をセットアップ] をクリックして Opsgenie アプリを設定します。
3.「Opsgenie に Splunk ITSI インテグレーションを追加する」の章で以前コピーした API URL を貼り付けます。
API キーのアップデート
alert_actions.conf から既定の API URL と優先順位をアップデートします ($SPLUNK_HOME/etc/apps/opsgenie_itsi/default ディレクトリにあります)。
Splunk ITSI アプリ ログでの Opsgenie のチェック
Opsgenie でアラートの作成中に問題が発生した場合は、$SPLUNK_HOME/var/log/splunk/opsgenie_itsi.log ファイルからアプリ ログをチェックできます。
[重要なイベントのレビュー] ページでのアラートの作成
IT Service Intelligence で、[重要なイベントのレビュー] ページに移動し、[重要なイベント] をクリックしてアラートを作成します。
[アクション]-> [Opsgenie でイベントを管理] をクリックします。
重要なイベント集約ポリシーを使用した自動アラートの作成
[設定]-> [Notable Event Aggregation Policies (重要イベント アグリゲーション ポリシー)] の順にクリックします。
2. 新しい重要なイベント集約ポリシーを作成するか、既存のポリシーを編集します。
3. [アクション ルール] タブで、ルールを追加し、「Opsgenie でイベントを管理する」ためのアクションをアップデートします。
4. [設定] をクリックし、Opsgenie の API URL を使用し、優先度を選択します。
5. [保存] をクリックします。
アクション マッピング機能
Opsgenie では、ユーザーは Opsgenie と Splunk ITSI の各アクション間のアクション マッピングを定義できます。
Splunk ITSI によって作成されたアラートの場合
このセクションを使用して、アラートのソースが Splunk ITSI である場合に、Opsgenie のアクションを Splunk ITSI のアクションにマッピングします (アラートが Splunk ITSI インテグレーションによって作成された際など)。
Opsgenie アクションごとに異なる PRTG アクションにマップします。たとえば、アラートが承認済みの場合、Splunk ITSI で重要なイベントのステータスを [進行中] に設定します。これを行うには、[アラート アップデートを Splunk ITSI に戻す] セクションで、[Opsgenie でアラートが承認済みの場合]、[重要なイベントのステータスを進行中にアップデート] マッピングを定義します。
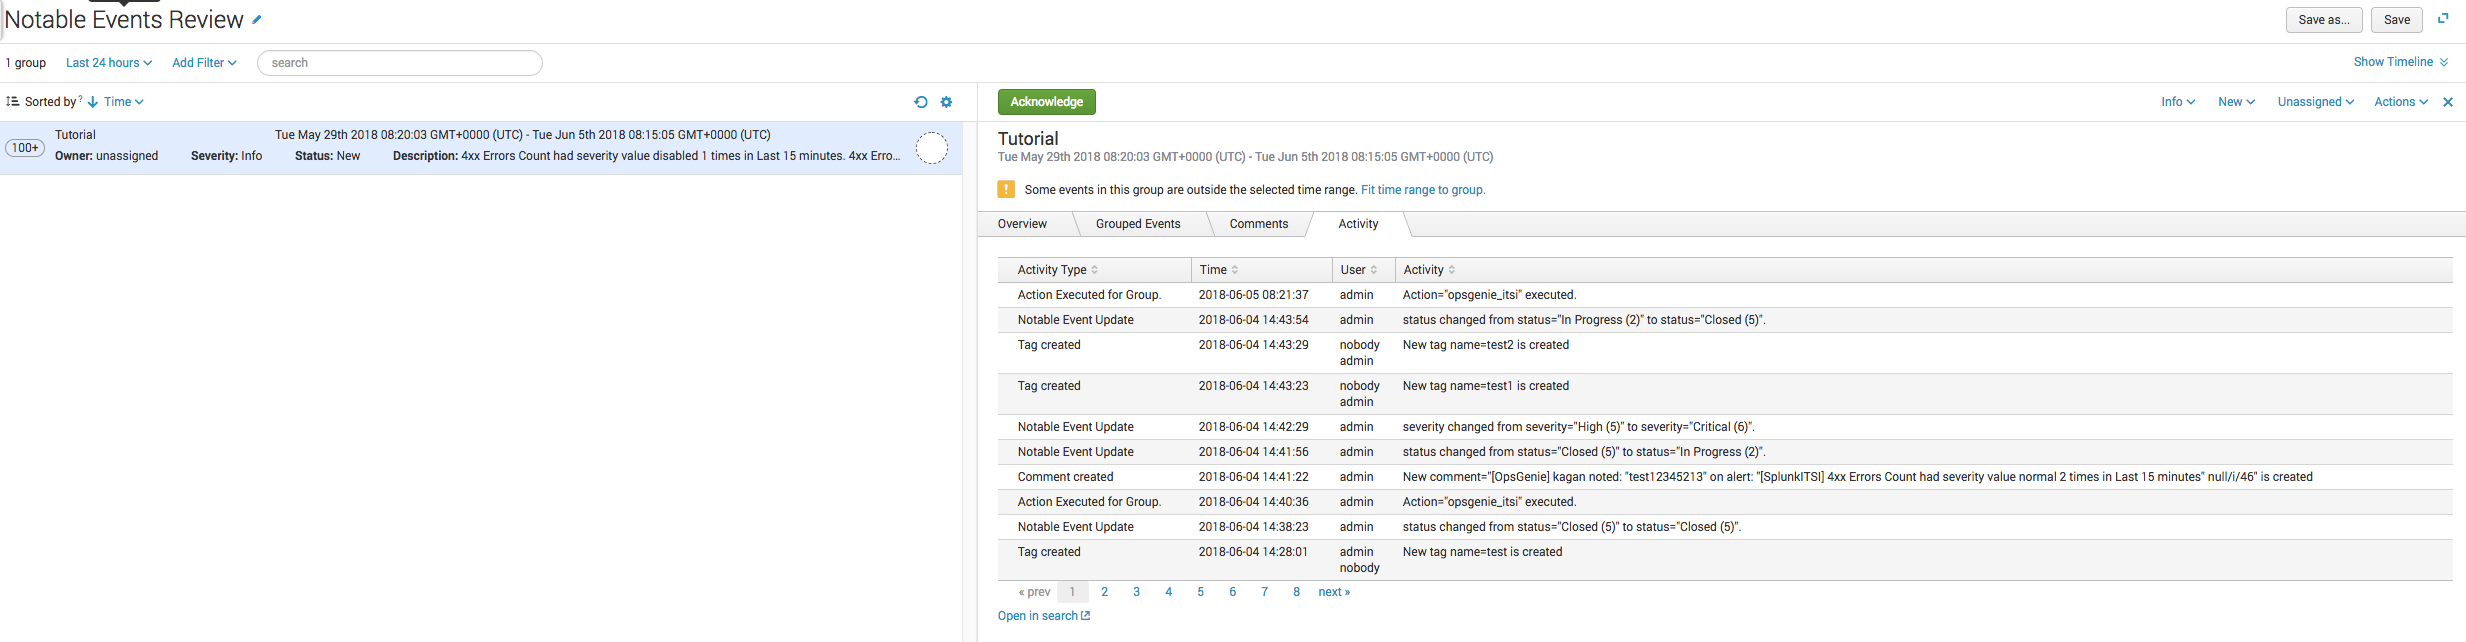
Opsgenie でアップデート アクションがトリガーされると、アップデートは重要なイベントに戻され、[アクティビティ] タブにアップデートが表示されます。
Splunk ITSI 重大度マッピングに対する Opsgenie の優先度
アラートの優先順位をアップデートすると、Splunk ITSI にアクションが送信され、重要イベントの重要度がアップデートされます。
P1 アラート -> 重度
P2 アラート -> 高
P3 アラート -> 中
P4 アラート -> 低
P5 アラート -> 情報
Opsgenie の Splunk フィールドとドラッグ可能なフィールドから送信されるペイロードのサンプル
アラートのペイロードを作成します。
JSON
{
  "title": "Tutorial",
  "severity_label": "test+label",
  "timeDiff": "900.000",
  "search_now": "1527605880.000",
  "service_kpi_ids": "92c7c8cc-70d4-4976-8c4d-f87d6234ca28:b5d1e7b2e8d1bcc64f",
  "is_service_max_severity_event": "1",
  "priority": "P3",
  "entity_title": "",
  "gs_service_id": "92c7c8cc-70d4-4976-8c4d-f874ca28",
  "composite_kpi_id": "test_kpi_id",
  "orig_index": "itsi_summary",
  "percentage": "100",
  "search_type": "composite_kpi_percentage_type",
  "health_score": "5",
  "search_name": "Buttercup Correlation Search",
  "linecount": "1",
  "color": "",
  "kpi": "4xx Errors Count",
  "scoretype": "2",
  "enabled": "1",
  "alert_severity": "urgent",
  "is_service_in_maintenance": "0",
  "owner": "unassigned",
  "event_identifier_hash": "f90c181ba0b3291864f50e6d5313f4a5ceb701c19b307bef72b8",
  "indexed_is_service_max_severity_event": "1",
  "alert_period": "5",
  "is_service_aggregate": "1",
  "source": "Buttercup Correlation Search",
  "composite_kpi_name": "test_kpi_name",
  "occurances": "1",
  "drilldown_uri": "null",
  "indexed_is_service_aggregate": "1",
  "splunk_server_group": "14",
  "indexed_itsi_kpi_id": "b5d1e7b2e8d1b5cc64f",
  "orig_severity": "normal",
  "kpi_name": "",
  "timeDiffInMin": "15.0000",
  "severity": "4",
  "host": "ip-172-31-38-242",
  "indexed_itsi_service_id": "92c7c8cc-70d4-4976-8c4d-f87ca28",
  "service_name": "",
  "change_type": "21",
  "index": "itsi_tracked_alerts",
  "total_occurrences": "3",
  "service_ids": "92c7c8cc-70d4-4976-8c4d-f87da28",
  "kpibasesearch": "DA-ITSI-APPSERVER_Performance_Web_Transaction",
  "all_info": "4xx Errors Count had severity value normal 1 times in Last 15 minutes",
  "gs_kpi_id": "b5d1e794555cc64f",
  "orig_sourcetype": "stash",
  "tag": "test",
  "statement": "4xx Errors Count had severity value normal 1 times in Last 15 minutes",
  "latest_alert_level": "test+level",
  "drilldown_search_search": "null",
  "splunk_server": "ip-172-24-94-292",
  "kpi_urgency": "",
  "urgency": "0",
  "kpiid": "b5d1e7b2e8d1b55cc64f",
  "alert_color": "#99D18B",
  "alert_value": "0",
  "time": "test_time",
  "description": "4xx Errors Count had severity value normal 1 times in Last 15 minutes",
  "alert_level": "2",
  "event_id": "233aa640-6337-11e8-8ffe-06f182",
  "severity_value": "4",
  "event_description": "4xx Errors Count had severity value normal 1 times in Last 15 minutes"
}
この内容はお役に立ちましたか?