Integrate Opsgenie with Splunk IT Service Intelligence
Splunk ITSI has a notable event functionality to create alerts or trigger a script. Use Splunk ITSI alerts to monitor for and respond to specific events. Alerts use a saved search to look for events in real time or on a schedule. Alerts are triggered when search results meet specific conditions. Alert actions can be used to respond when alerts trigger.
What does Opsgenie offer Splunk ITSI users?
Splunk IT Service Intelligence's easily sift through vast amounts of events by filtering and sorting them based on priority. Additionally, Splunk ITSI triggers alerts, initiates remediation, and automates incident workflows. Real-time anomaly detection also reduces alert fatigue. Through Opsgenie for Splunk ITSI app, forward Splunk ITSI alerts to Opsgenie. With the Splunk ITSI Integration, Opsgenie acts as a dispatcher for these alerts, determines the right people to notify based on on-call schedules– notifies via email, text messages (SMS), phone calls, and iPhone & Android push notifications, and escalates alerts until the alert is acknowledged or closed.
Functionality of the integration
Opsgenie has a Splunk ITSI specific alert app to send Splunk ITSI alerts to Opsgenie. Opsgenie also has a specific API for Splunk ITSI Integration, Splunk ITSI sends alerts through Opsgenie for Splunk ITSI app to Opsgenie and Opsgenie handles the automatic creation of alerts.
Add Splunk ITSI Integration in Opsgenie
If you're using Opsgenie's Free or Essentials plan or if you’re using Opsgenie with Jira Service Management's Standard plan, you can add this integration from your team dashboard only. The Integrations page under Settings is not available in your plan.
Go to Teams and select your team.
Select Integrations on the left navigation and then select Add integration.
Adding the integration from your team dashboard will make your team the owner of the integration. This means Opsgenie will assign the alerts received through this integration to your team only. Follow the rest of the steps in this section to set up the integration.
Go to Settings > Integrations. Search for Splunk ITSI and select Add.
Specify who is notified of Splunk alerts using the Responders field. Auto-complete suggestions are provided as you type.
Copy the API URL.
Select Save Integration.
Configuration in Splunk ITSI
In Splunk, install Opsgenie for Splunk ITSI App from Splunkbase.
2. After installation, navigate to Settings-Alert Actions and click Setup Opsgenie for Splunk ITSI to configure Opsgenie App.
3. Paste the API URL copied in the chapter: Add Splunk ITSI Integration in Opsgenie.
Updating API URL
Update default API URL and priority from alert_actions.conf under $SPLUNK_HOME/etc/apps/opsgenie_itsi/default directory.
Checking Opsgenie for Splunk ITSI App logs
If any problems occur while creating an alert at Opsgenie, you can check App logs from $SPLUNK_HOME/var/log/splunk/opsgenie_itsi.log file.
Creating Alerts in the Notable Events Review Page
In IT Service Intelligence, go to the Notable Events Review page and click on a Notable Event to create an alert.
Click Actions-> Manage Event with Opsgenie.
Creating Automatized Alerts using Notable Event Aggregation Policies
Click Configure-> Notable Event Aggregation Policies.
2. Create a New Notable Event Aggregation Policy or edit an existing one.
3. In the "Action Rules" tab, add a Rule and update action to "Manage Event with Opsgenie".
4. Click Configure and use Opsgenie’s API URL and select the priority.
5. Click Save.
Action Mapping Feature
Opsgenie allows customers to define action mappings between Opsgenie actions and Splunk ITSI actions.
For alerts created by Splunk ITSI
Use this section to map Opsgenie actions to Splunk ITSI actions when the source of the alert is Splunk ITSI (i.e When the alert is created by Splunk ITSI integration.)
Map different Opsgenie actions to different Splunk ITSI actions. For example, set the Notable Event status to "In Progress" in Splunk ITSI, when the alert is acknowledged. In order to do this, define "If alert is acknowledged in Opsgenie", "update Notable Event Status to In Progress" mapping in the "Send Alert Updates Back to Splunk ITSI" section.
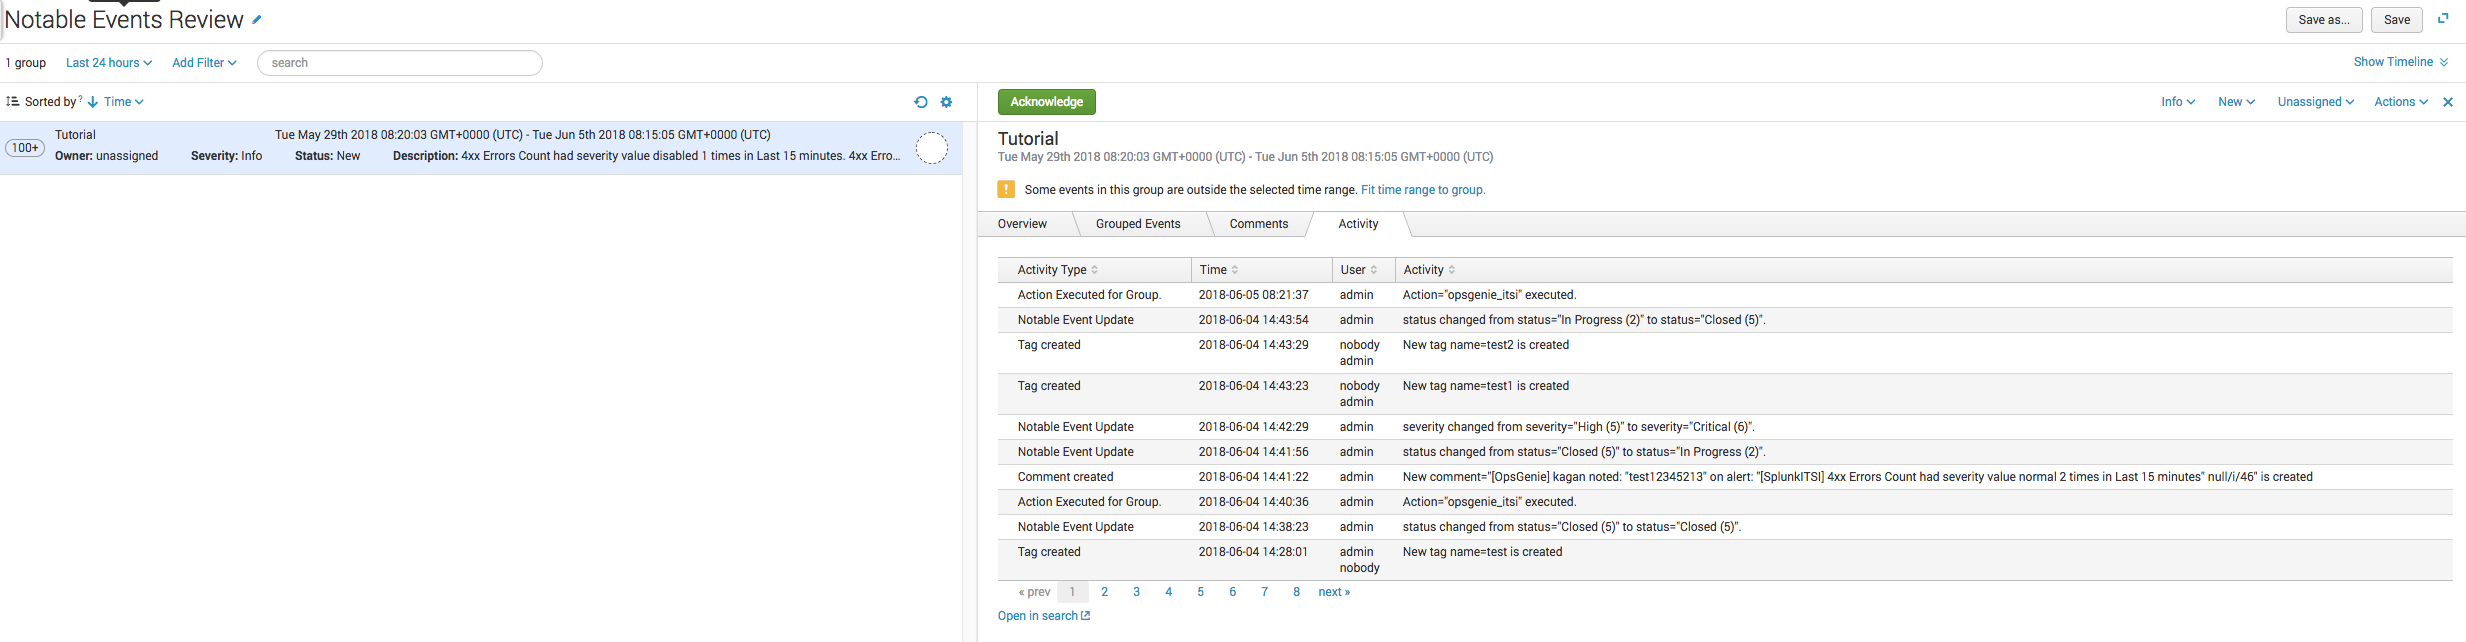
After the update action is triggered in Opsgenie, updates are sent back to the Notable Event and updates are viewed from the "Activity" tab.
Opsgenie Priority to Splunk ITSI Severity Mapping
After updating alert priority, action will be sent to Splunk ITSI and update the severity of the Notable Event.
P1 Alert -> Critical
P2 Alert -> High
P3 Alert -> Medium
P4 Alert -> Low
P5 Alert -> Info
Sample payload sent from Splunk and Draggable Fields in Opsgenie
Create Alert payload:
JSON
{
  "title": "Tutorial",
  "severity_label": "test+label",
  "timeDiff": "900.000",
  "search_now": "1527605880.000",
  "service_kpi_ids": "92c7c8cc-70d4-4976-8c4d-f87d6234ca28:b5d1e7b2e8d1bcc64f",
  "is_service_max_severity_event": "1",
  "priority": "P3",
  "entity_title": "",
  "gs_service_id": "92c7c8cc-70d4-4976-8c4d-f874ca28",
  "composite_kpi_id": "test_kpi_id",
  "orig_index": "itsi_summary",
  "percentage": "100",
  "search_type": "composite_kpi_percentage_type",
  "health_score": "5",
  "search_name": "Buttercup Correlation Search",
  "linecount": "1",
  "color": "",
  "kpi": "4xx Errors Count",
  "scoretype": "2",
  "enabled": "1",
  "alert_severity": "urgent",
  "is_service_in_maintenance": "0",
  "owner": "unassigned",
  "event_identifier_hash": "f90c181ba0b3291864f50e6d5313f4a5ceb701c19b307bef72b8",
  "indexed_is_service_max_severity_event": "1",
  "alert_period": "5",
  "is_service_aggregate": "1",
  "source": "Buttercup Correlation Search",
  "composite_kpi_name": "test_kpi_name",
  "occurances": "1",
  "drilldown_uri": "null",
  "indexed_is_service_aggregate": "1",
  "splunk_server_group": "14",
  "indexed_itsi_kpi_id": "b5d1e7b2e8d1b5cc64f",
  "orig_severity": "normal",
  "kpi_name": "",
  "timeDiffInMin": "15.0000",
  "severity": "4",
  "host": "ip-172-31-38-242",
  "indexed_itsi_service_id": "92c7c8cc-70d4-4976-8c4d-f87ca28",
  "service_name": "",
  "change_type": "21",
  "index": "itsi_tracked_alerts",
  "total_occurrences": "3",
  "service_ids": "92c7c8cc-70d4-4976-8c4d-f87da28",
  "kpibasesearch": "DA-ITSI-APPSERVER_Performance_Web_Transaction",
  "all_info": "4xx Errors Count had severity value normal 1 times in Last 15 minutes",
  "gs_kpi_id": "b5d1e794555cc64f",
  "orig_sourcetype": "stash",
  "tag": "test",
  "statement": "4xx Errors Count had severity value normal 1 times in Last 15 minutes",
  "latest_alert_level": "test+level",
  "drilldown_search_search": "null",
  "splunk_server": "ip-172-24-94-292",
  "kpi_urgency": "",
  "urgency": "0",
  "kpiid": "b5d1e7b2e8d1b55cc64f",
  "alert_color": "#99D18B",
  "alert_value": "0",
  "time": "test_time",
  "description": "4xx Errors Count had severity value normal 1 times in Last 15 minutes",
  "alert_level": "2",
  "event_id": "233aa640-6337-11e8-8ffe-06f182",
  "severity_value": "4",
  "event_description": "4xx Errors Count had severity value normal 1 times in Last 15 minutes"
}
Was this helpful?