Visual SQL steps
Visual SQL steps allow you to perform a variety of post-query manipulations in the Analytics app. Add other Visual SQL steps after the initial query of your chart to edit that query’s results.
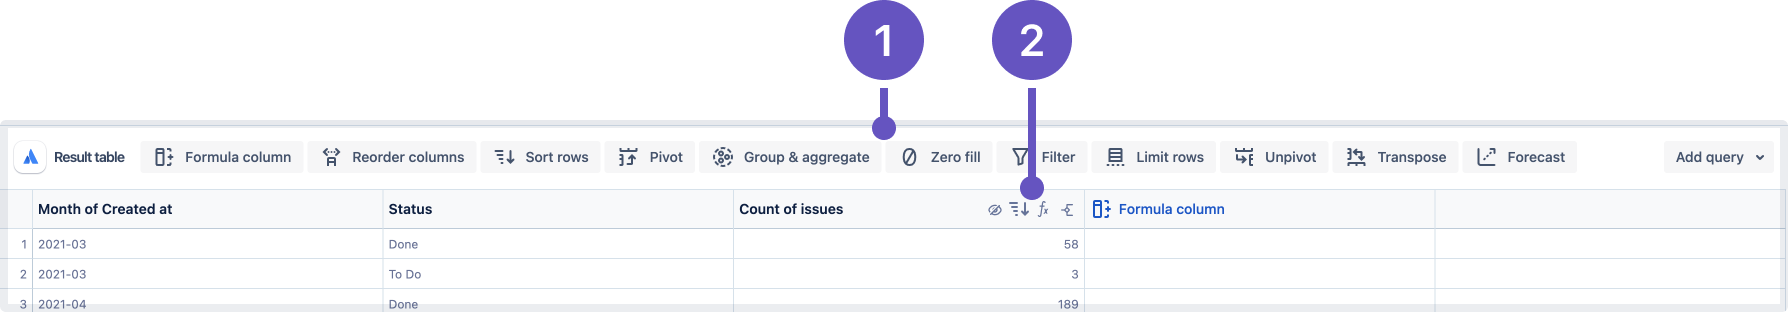
Visual SQL steps are located in two areas:
Steps that affect the entire result table are generally found directly above the result table
Steps that affect a single column are found when you hover over the column
Keep in mind that steps only appear after you select Run query for your initial query.
For all Visual SQL steps (except “Add query” and “Filter”), you can submit their forms by pressing Enter or Return.
Add query
Queries are the cornerstone for creating charts. This is where you’ll pull the data you want to show. All charts must start with an initial query. To help you remember this, all new charts always add and expand the first "Query" step.
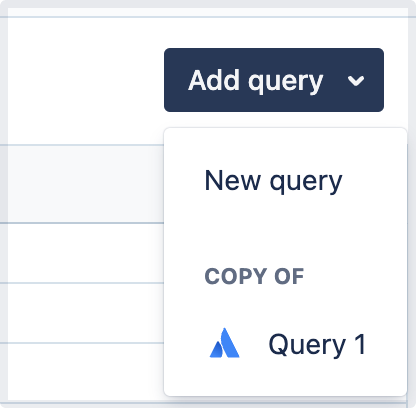
Once you’ve executed your initial query, you can add a new query by selecting Add query above the result table. This opens a dropdown where you can choose to either:
create an empty new query
copy an existing query
The query is a major part of Visual SQL, and there are two query modes you can choose from:
Rename a query
Give descriptive names to your queries so it’s easier to identify the purpose of each query, especially when you need to edit one. To rename a query:
Select its current name in the "Query" step block.
Type in the desired query name.
Press
Enteror click outside of the text field to save the new query name.
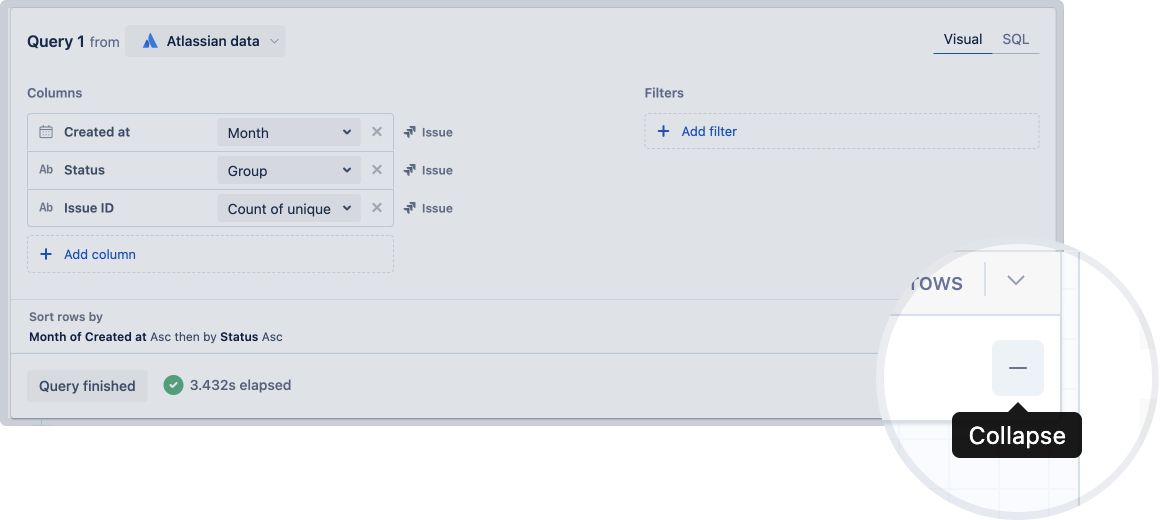
Collapse a query
To collapse the query, select the Collapse icon of the query.
Join
Merge the result sets of two queries by joining them together. You can’t manually add a “Join” step to Visual SQL; it only appears after you’ve merged a second query. Learn more about merging queries.
You can select a different join type and—depending on that join type—select how many columns to join by and whether to include or exclude certain types of data from the merged result set.
You can select the number of columns to join by for outer, inner, and left joins. Learn more about available join types.
Apply formula
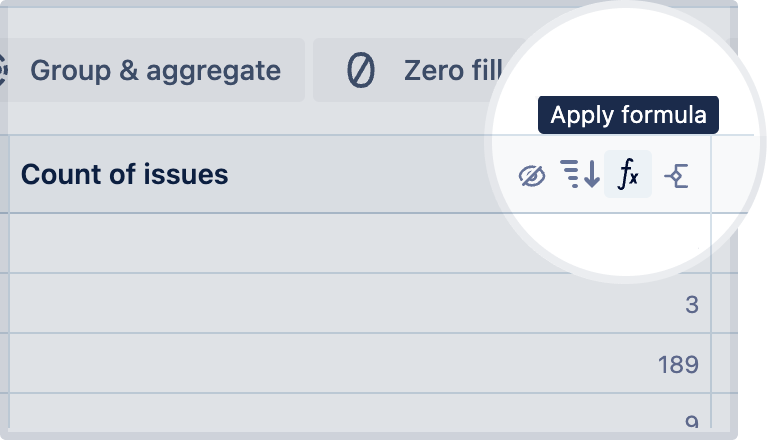
Apply a calculation to an existing column in column in the result set:
Hover over the column in the result table.
Select the Apply formula icon.
Select the type of formula you want to use: guided or custom. The available guided formulas depend on the column’s data type, but all columns allow you to use a custom formula. Learn more about guided formulas and custom formulas.
Select Save.
Use the “Apply formula” step to change the values in the column itself, rather than using a “Formula column” step then hiding the original column.
Bucket data
The “Bucket data” step takes a numeric data column and groups it into separate buckets according to the conditions that you specify. This data is then used to aggregate the data within each bucket.
The result of this step is a two-column output, with the first column representing the data buckets and the second column containing the aggregated values. To perform a “Bucket data” step:
Select Bucket data above the result table
Select the name of the column that you would like to apply the bucket step.
Select how you’d like to aggregate each data bucket. The available aggregations are:
Count: counts how many data points are in each category
Average: calculates the mean or average value of the data within each bucket
Maximum: identifies the highest value in each bucket
Minimum: identifies the lowest value in each bucket
Sum: adds up all the data points within a bucket
Select the data bucket type that you want to use. The available data bucket types are:
Standard deviation: size of each bucket is the standard deviation of the values in the selected column
Bucket size: specify the size of each bucket
Number of buckets: specify the total number of buckets you want to create
In the example shown below, the “Bucket data” step is used on the "Cycle time (days)" column with “Count” as the aggregation type. It counts the number of occurrences within each bucket, where each bucket represents a range of ten days.
Filter
Filter rows based on certain conditions.
Select where to include or exclude rows matching any or all specified filter conditions:
Matching all conditions: Uses
ANDlogic. Includes or excludes a row only if it matches every filter condition.Matching any conditions: Uses
ORlogic. Includes or excludes a row if it matches one or more conditions.
Unlike the filters in a "Query" step, you can only filter by columns in your result set.
Consecutive “Filter” steps in Visual SQL are connected by an implicit AND operator. With this, you can create a chain of AND-OR filter conditions.
Regular expression matching
Any text column supports filtering by Java-style regular expressions in the “Filter” step. Matching is case-sensitive and unicode-aware by default. For case-insensitive matching, add (?i) to the beginning of your regular expression.
Forecast
Provide predictive data for a column in your query results. Select whether to add data to the existing column or create a new one, the number of rows returned, and the type of extrapolation used (cubic, quadratic, or linear).
Formula column
Add a formula column to your query results by doing either of the following:
Select Formula column above the result table
Select the rightmost column labeled +Formula column in the result table
Similar to the “Apply formula” step, use either a guided formula or custom formula to manipulate or add data.
Group & aggregate
Change the grouping or aggregation of columns.
This is exactly like selecting to group or aggregate a column from its aggregation menu in a visual mode query, but now you can change the type of group or aggregation at any point in Visual SQL.
The aggregation types also include an extra option: Concatenate. This strings together grouped values into a comma-separated list.
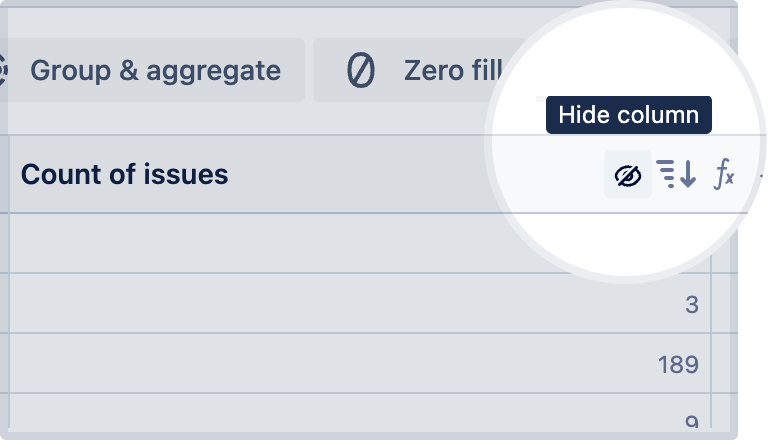
Hide column
Hide a column in your result set.
Hover over the column and select the Hide column icon. Once you hide a column, it won’t show in your result table.
If you need to use hidden columns in a formula, hide the columns as the last step. Columns must be present in the result table to use in other steps, aggregations, or custom formulas.
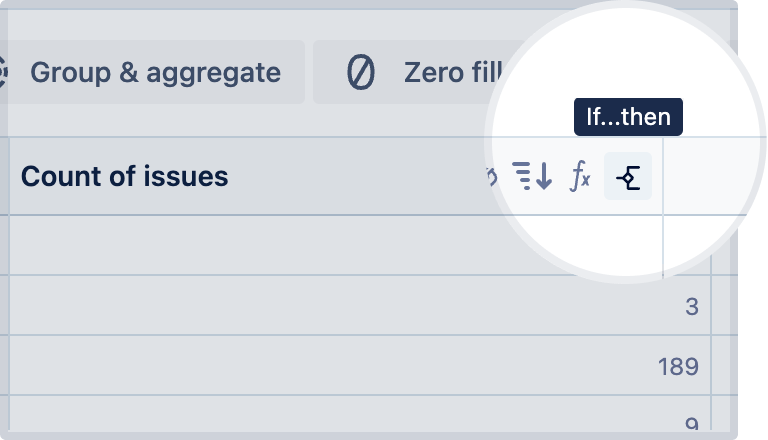
If…then
Add a column to your result set where the values depend on whether or not any of the specified conditional statements are met.
Hover over the column whose values you’d like to evaluate and select the If…then icon.
If you want to add multiple conditions for a particular case or reference multiple columns, you’ll need to use a “Formula column” step, select Custom as the formula type, then type your custom CASE statement.
Limit rows
Limit the number of rows included in your result set.
This can be useful when applied after a sort. For example, sort sales in descending order and limit rows to 10 to show the top 10 sales.
The starting with row number field is the offset; it helps you select a specific range of rows. For example, to include only rows 10-30, set the limit to 20 and the offset to 10.
If you’re trying to limit the rows of your initial query, you could modify the row limits in the "Query" step itself rather than adding a separate “Limit rows” step.
Pivot
Turn the values in the second column of a three-column result set into column headers.
If your chart has one numeric column grouped by two categorical columns, such as count of activity grouped by month and by activity type, you’ll want to pivot that data so you can use it in a chart.
Select Unsorted, Ascending, or Descending for the sort direction to change the order that the columns appear after the pivot.
Select how you’d like to aggregate duplicate group values. The available aggregations are:
Auto: Uses either sum or concatenation, depending on the data type
Sum
Avg (average)
Median
Min (minimum)
Max (maximum)
Concatenate
Rename column
Change the name of a column in your result set.
To rename a column:
Select its column name in the result table.
Type in the new column name.
Press
Enteror select outside of the text field to save it.
This is useful for display purposes or shortening column names for ease of use in formulas. Once you rename a column, you’ll use the new name in all future steps.
Renaming a column after a query will update the column alias in the query itself and not add a “Rename column” step to Visual SQL.
Reorder columns
Quickly drag and drop columns in the result table to put them in the desired order.
Sort rows
Sort the values of multiple columns in a single step or sort only a single column’s values.
To sort the values of multiple columns in a single step:
Select Sort rows above the result table.
Select a column and the sort direction to apply to it.
Select Add sort to add another column.
Repeat Step 3 as needed.
Select Save to apply the sort.
This type of sorting is nested, just like how the query sort works. Learn more about sorting in a visual mode query.
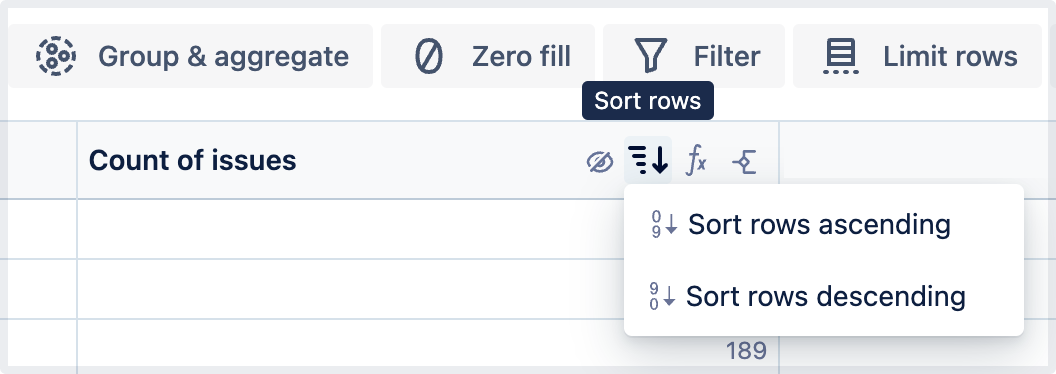
To sort a single column’s values:
Hover over the column whose values you want to sort.
Select the Sort rows icon.
Select the sort direction.
This type of sorting is not nested. If you add multiple “Sort rows” steps, the last one listed in Visual SQL takes precedence. All the “Sort rows” steps before it are ignored.
Transpose
Switch your rows and columns.
There are no limits on the input table format, but the resulting table cannot contain more than 1,000 columns.
Unpivot
Unpivot a single-row table, turning the column headers into a single column named Category—basically the opposite of what the “Pivot” step does.
Select Three column result to ignore the first column and only unpivot the second to the last columns in your result set.
Unpivoting your data is useful when you have multiple single-value columns that you want to use in a visualization, such as a pie, line, or bar chart.
Zero fill
Fill in missing values in your data with zeros.
It’s important when display a time series with missing dates in a chart, or when performing calculations on columns that contain null values.
The “Zero fill” step fills in all date and numeric columns in your query results.
Zero fill example
The result set before “Zero fill” step:
The result set after “Zero fill” step:
Was this helpful?