What is Visual SQL?
Visual SQL is where a bulk of the magic happens in the Analytics app—it’s what you’ll use to create your charts. It’s the full series of query and transformation steps taken to achieve your final chart. As the name suggests, we’ve made SQL visual, to empower users of all backgrounds to explore their data. It’s intuitive for business users, fast for power users, transparent for SQL pros, and flexible for programmers.
When you create a new chart, Visual SQL starts with an expanded query step in visual mode where you’ll edit and execute your initial query. From there, you can transform your query result with other Visual SQL steps, view the result sets of those transformations, and ultimately visualize those results to add to your dashboard and share with others.
Visual SQL is also used to create other resources in Analytics, such as “Dropdown” controls and “Date slider” controls. Learn more about controls.
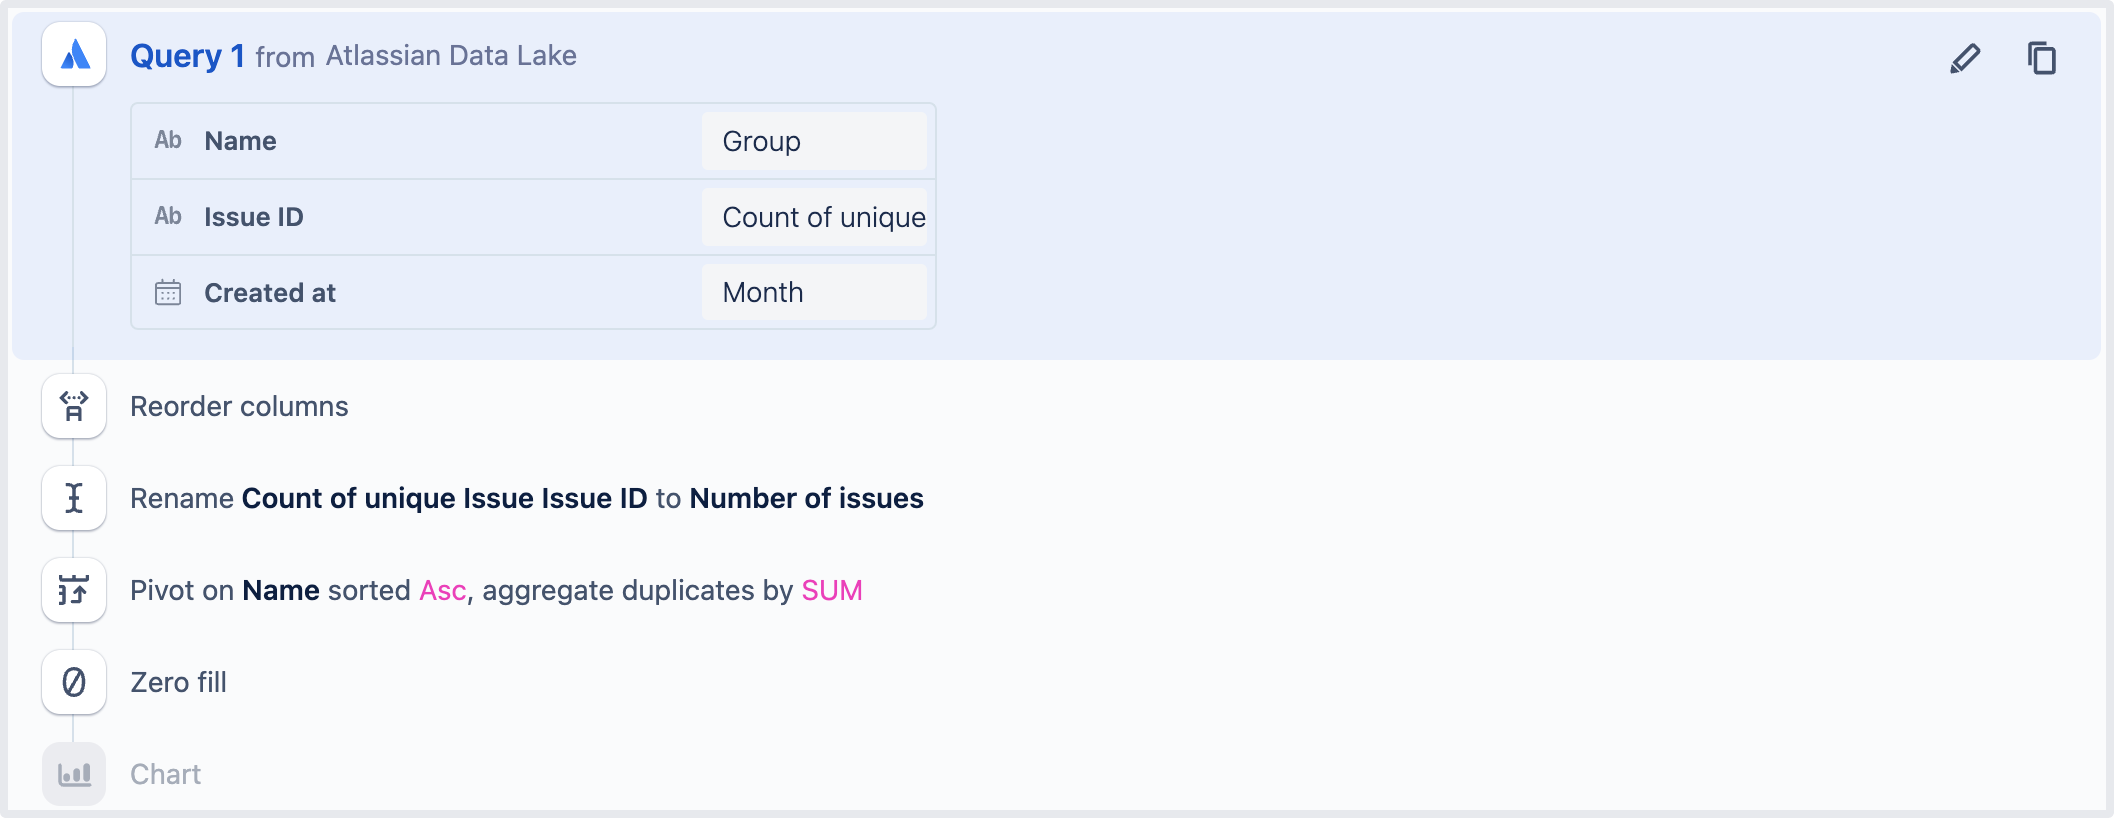
The image above shows an example series of Visual SQL steps. The “Query” step is first, followed by a “Reorder columns” step, then a “Rename column” step, then a “Pivot” step, then a “Zero fill” step, and finally a “Chart” step.
Was this helpful?