
Get chart insights using AI
Analytics is now Insights
All of the Analytics capabilities of the app remain unchanged. You can continue using your existing dashboards, charts, and smart links alongside the new Rovo-powered features. These features combine work and data context to provide reliable answers, create a shared understanding of data, and build dashboards that your team can depend on.
Atlassian Intelligence is available and automatically activated for all products on Premium and Enterprise plans. Organization admins can manage Atlassian Intelligence preferences from Settings > Atlassian Intelligence in Atlassian Administration.
Atlassian Intelligence isn’t available in the Atlassian Government environment.
Use Atlassian Intelligence (AI) to supplement your interpretation of your chart data. It can:
Provide a brief description of the chart data
Identify trends
Highlight potential anomalies or areas of interest in a given chart
To get chart insights using AI:
Open a dashboard in Analytics.
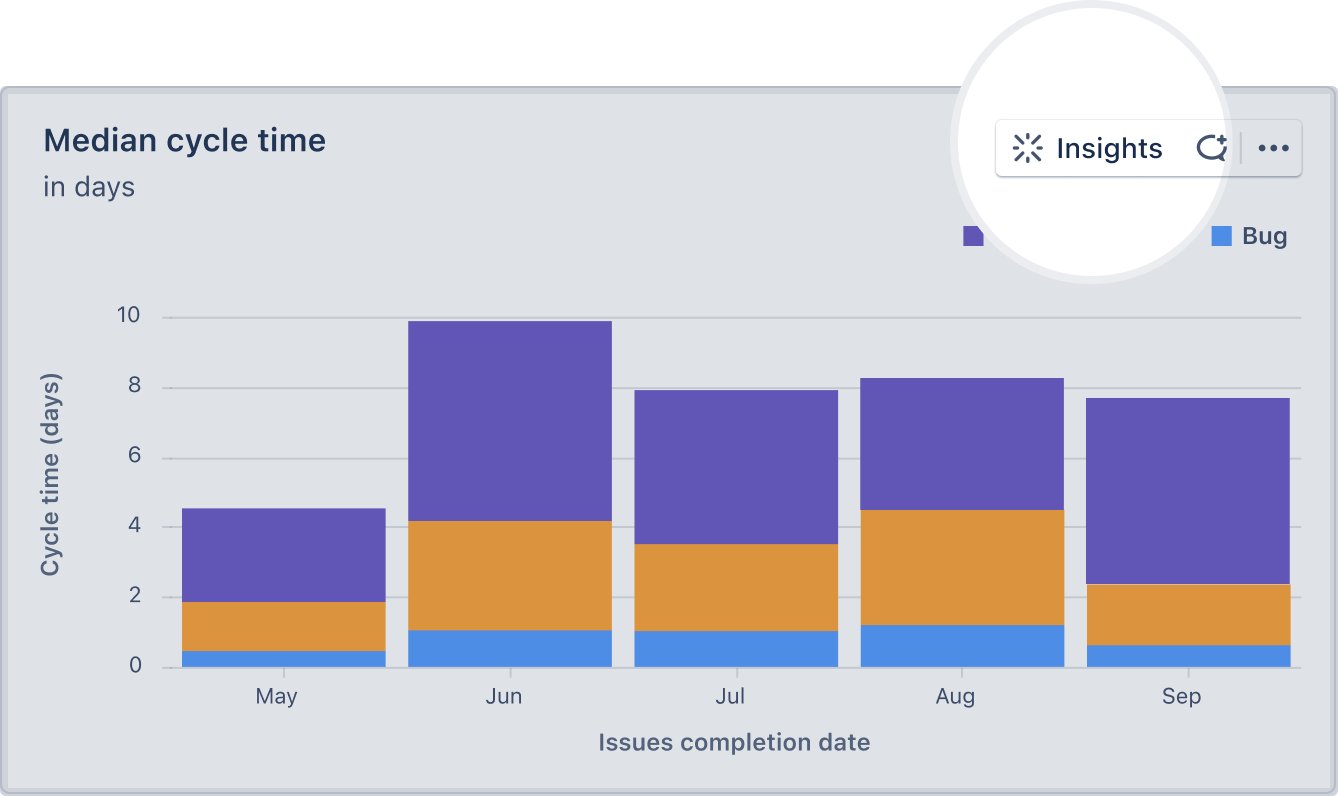
Hover over a chart then select Insights. Note that Atlassian Intelligence doesn’t generate insights for bubble map and map charts.
A pop-up will appear where Atlassian Intelligence will generate and display insights for the chart.
The quality, accuracy, and reliability of information generated by Atlassian Intelligence may vary. Learn why
Was this helpful?