“Portfolio financials” dashboard template
This dashboard provides you with data that details the financial impact of the epics being planned and delivered within a portfolio. Financial values on the dashboard are taken from fields found in the Spend tab of Jira Align epics' details panels.
Controls on the dashboard
Use the following controls to configure the dashboard:
Portfolio | “Dropdown” control to filter all charts for the specific portfolio that your work items are associated with |
|---|---|
Select a date range | “Calendar” control to filter all charts for data relating to work items assigned to program increments that fall within the selected date range. |
Themes | “Dropdown” control to filter the Epics table chart for specific themes. |
Programs | “Dropdown” control to filter the Epics table chart for specific programs. |
Charts on the dashboard
Quick overview
The quick overview section displays financial statistics from the epics associated with the selected portfolio and date range.
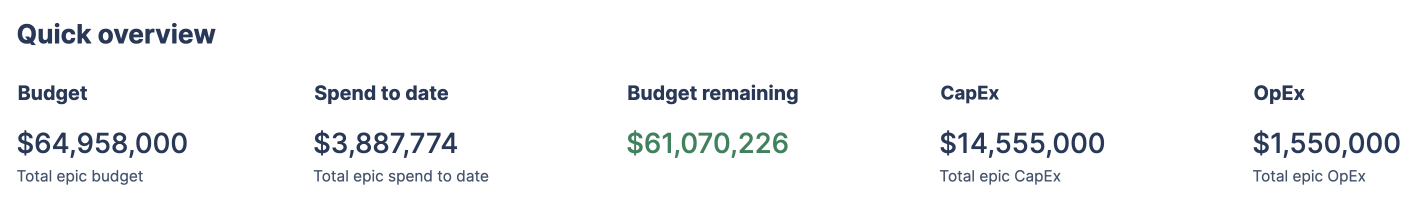
Budget
Displays the sum of values entered in the Budget field from all epics within the selected filters.
Spend to date
Displays the sum of values entered in the Spend to date field from all epics within the selected filters.
Budget remaining
Displays the difference between the “Budget” and “Spend to date” totals.
CapEx
Displays the sum of values entered in the CapEx field from all epics within the selected filters.
OpEx
Displays the sum of values entered in the OpEx field from all epics within the selected filters.
Themes: Budget vs. spend
A bar chart that displays the sums of Budget and Spend to date fields from epics parented by each theme within the selected filters.
Portfolio objectives: Budget vs. spend
A bar chart that displays the sums of Budget and Spend to date fields from epics associated with each portfolio objective within the selected filters.
Epic details
Displays financial details from epics within the selected filters. Use the Themes and Programs controls above the table to filter the epics further. The table provides insight into each epic’s status, state, owner, target completion, and parent theme. The table is intended to help you pinpoint epics that may be off-track or over/under budget.
Was this helpful?