Set up a “Date slider” control
“Date slider” controls let you focus on a specific date range for your data.
Setting up a “Date slider” control requires two main steps:
Create the “Date slider” control.
Connect the “Date slider” control to a chart.
Create a “Date slider” control
To add a “Date slider” control to your dashboard:
Open the dashboard where you want to add the “Date slider” control.
Select Add control > Date slider from the dashboard sidebar. A pop-up will appear.
Optionally, change the Name of the control.
Select a Data source then select a Column. The “Date slider” control uses values from the selected date column to define its date range.
Edit the Default start and end dates using fixed dates, or use a combination of relative date variables and date and time functions for dynamic filtering.
Optionally, select Connect this control to new and existing charts.
Select Add.
Place the newly created “Date slider” control anywhere on your dashboard.
Create a “Date slider” control with the control editor
Using the control editor gives you more flexibility when defining the date range of your “Date slider” control. You can use Visual SQL to create queries and apply other transformations to the date range of your “Date slider”. Unlike “Calendar” controls, which only let you see dates, you could also add numerical data to your “Date slider” to quickly see how certain data is trending over time.
Open the dashboard where you want to add the “Date slider” control.
Select Add control > Date slider from the dashboard sidebar. A pop-up will appear.
Select Switch to control editor. Learn more about the control editor.
Note: The changes you make in the pop-up won’t carry over to the control editor.Add a date column to the “Columns” section of the query.
Optionally, add a numeric column to make a “Date slider” control that displays spikes of activity in your date range.
Select Run query. The preview pane will update so you can configure the control settings.
Optionally, change the Name of the control.
Edit the Default start and end dates using fixed dates, or use a combination of relative date variables and date and time functions for dynamic filtering.
Optionally, select a Background color for your control. By default, it uses the color from the dashboard theme.
Select Save to dashboard.
Place the newly created “Date slider” control anywhere on your dashboard.
Connect a “Date slider” control to charts
After you’re created your “Date slider” control, you’ll need to connect it to a chart to start using it to filter. Connect it to a chart by using its corresponding dashboard variable in a query.
Automatically connect to new and existing charts
For a “Date slider” to automatically connect to a chart, the queries within the chart must:
be built using visual mode
use the same data source as the control
A “Date slider” control created using the control editor can't be automatically connected to all charts.
If the chart's queries meet these criteria, we’ll automatically apply a query filter to the visual mode queries.
To automatically connect the control to all charts:
Create the “Date slider” control or edit an existing one by hovering over it and then selecting More actions () > Edit control.
Select Connect to new and existing charts.
Select a Filter operator to use in the automatically applied query filter. Learn more about the available filter operators.
Select Add or Save to apply the changes to the control.
Manually connect to charts
If you can't automatically connect the control to all charts or choose to not do so, you can manually connect it to individual charts by using the control’s corresponding dashboard variable in a query.
You can also connect controls in other Visual SQL steps. Learn more about connecting controls outside of a query.
In a visual mode query
To connect a “Date slider” control to a chart using a visual mode query:
Open the chart editor by creating a new chart or editing an existing chart on the dashboard.
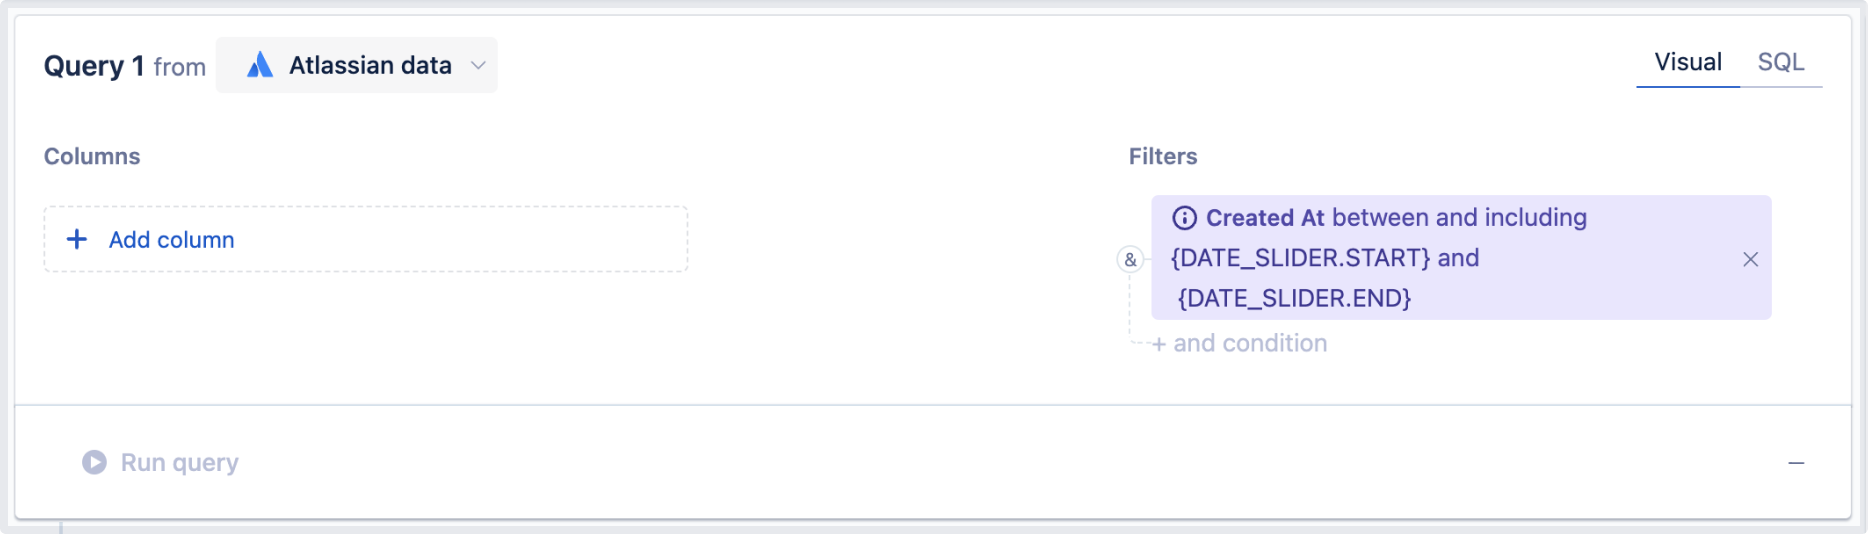
In the “Filters” section of your visual mode query:
Add the date column you want the control to filter.
Select the filter operator. Most people use between and including.
Reference your control using its dashboard variable:
Use
{DATE_SLIDER_NAME.START}for the start date.Use
{DATE_SLIDER_NAME.END}for the end date.Replace
DATE_SLIDER_NAMEwith the name of your control.
Select Run query. The result table will update with the new filter applied to the data.
Select Save to dashboard to save the chart.
In a SQL mode query
Connect a “Date slider” control in your SQL mode query by referencing the control using its dashboard variable:
Use
{DATE_SLIDER_NAME.START}for the start date.Use
{DATE_SLIDER_NAME.END}for the end date.
Replace DATE_SLIDER_NAME with the name of your control.
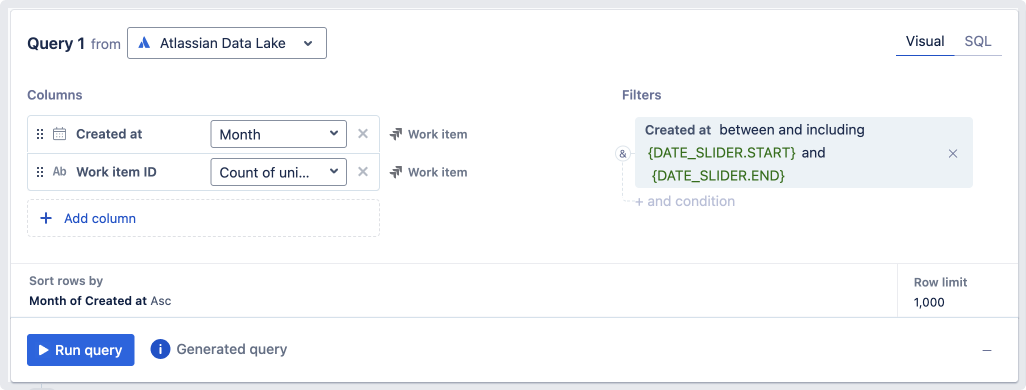
Here’s an example of how you might get the total number of Jira work items created between the selected dates of a “Date slider” control:
SELECT DATE_FORMAT(`Work item`.`created_at`, 'yyyy-MM') AS `Month of Created at`,
       COUNT(DISTINCT `Work item`.`issue_id`) AS `Count of unique Work item ID`
FROM `jira_issue` AS `Work item`
WHERE `Work item`.`created_at` BETWEEN {DATE_SLIDER_NAME.START} AND {DATE_SLIDER_NAME.END};
Verify your chart is connected to the control
To make sure you’ve properly connected your chart to the control, you could verify this by updating the values of the control and seeing if your connected chart filters accordingly.
Alternatively, there are two ways you can check for all charts that are connected to the control.
One option is to:
Hover over the control.
Select its More actions () menu > Highlight connections.
The other option is to:
Select Settings from the dashboard sidebar.
Go to the Controls tab.
Select Highlight connections.
Both options highlight all elements on the dashboard that are connected to that particular control.
Was this helpful?