Set up a “Dropdown” control
“Dropdown” controls let you display the values of a query into a searchable list.
Setting up a “Dropdown” control requires two main steps:
Create the “Dropdown” control.
Connect the “Dropdown” control to a chart.
Create a “Dropdown” control
To add a “Dropdown” control to your dashboard:
Open the dashboard where you want to add the “Dropdown” control.
Select Add control > Dropdown from the dashboard sidebar. A pop-up will appear.
Optionally, change the Name of the control.
If you want to filter for multiple values in the control at once, select Multiple select.
Select a Data source and a Column. The “Dropdown” control displays the values from the selected column as its list of options.
Optionally, select Connect this control to new and existing charts. Learn more about connecting the control to charts.
Select Add.
Place the newly created “Dropdown” control anywhere on your dashboard.
Create a “Dropdown” control with the control editor
Using the control editor gives you more flexibility when defining your “Dropdown” control. You can use Visual SQL to create queries and apply other transformations to the options in your “Dropdown.”
Open the dashboard where you want to add the “Dropdown” control.
Select Add control > Dropdown from the dashboard sidebar. A pop-up will appear.
Select Switch to control editor. Learn more about the control editor.
Note: The changes you make in the pop-up won’t carry over to the control editor.Add the column you want to use for your category to the “Columns” section of the query. The values in that column will populate the options in the “Dropdown” control.
Select Run query. The preview pane will update so you can configure the control settings.
Edit the control’s settings as needed. Learn more about “Dropdown” settings.
Optionally, select a Background color for your control. By default, it uses the color from the dashboard theme.
Select Save to dashboard.
Place the newly created “Dropdown” control anywhere on your dashboard.
“Dropdown” controls only display up to 1,000 values, but you can still search for any values that don’t appear in the list.
“Dropdown” control settings
You can edit the following settings for your “Dropdown” control:
Name
The name of the control
Data type
The data type of your “Dropdown” results:
Text
Number
Boolean
Date
Multiple select
Allows filtering by multiple values at once. If this is deselected, you can only select one value in the “Dropdown” control at a time.
When no values are selected
Only available when Multiple select is selected
Specifies what happens when no values are selected in the “Dropdown” control. There are two options:
Show unfiltered chart data: Does not filter the connected charts
Show no chart data: Shows no data for the connected charts
Initial values
Set default values to select when you open the dashboard
Connect a “Dropdown” control to charts
After you’ve created your “Dropdown” control, you’ll need to connect it to a chart to start using it to filter. Depending on how you created the control, you can either automatically connect it to all new and existing charts on the dashboard or manually connect it to a chart.
Automatically connect to new and existing charts
For a “Dropdown” to automatically connect to a chart, the queries within the chart must:
be built using visual mode
use the same data source as the control
A “Dropdown” control created using the control editor can't be automatically connected to all charts.
If the chart's queries meet these criteria, we’ll automatically apply a query filter to the visual mode queries.
To automatically connect the control to all charts:
Create the “Dropdown” control or edit an existing one by hovering over it and selecting More actions () > Edit control.
Select Connect to new and existing charts.
Select a Filter operator to use in the automatically applied query filter. Learn more about the available filter operators.
Select Add or Save to apply the changes to the control.
Manually connect to charts
If you can't automatically connect the control to all charts or choose to not do so, you can manually connect it to individual charts by using the control’s corresponding dashboard variable in a query.
You can also connect controls in other Visual SQL steps. Learn more about connecting controls outside of a query.
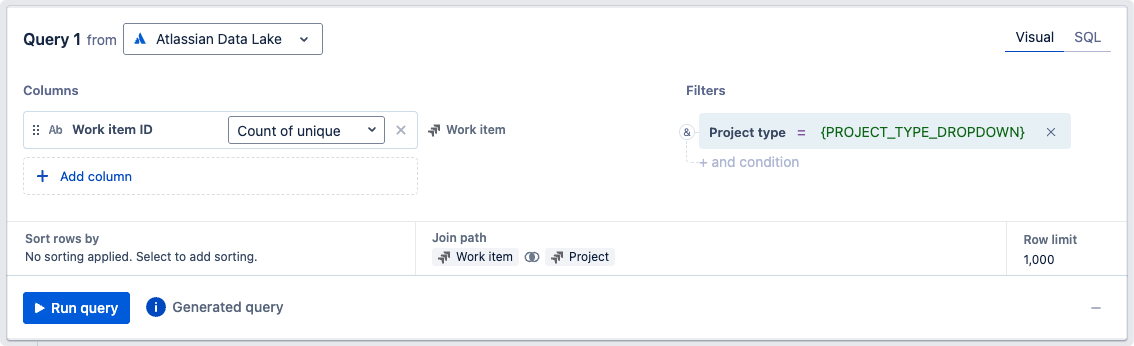
In a visual mode query
To connect a “Dropdown” control to a chart using a visual mode query:
Open the chart editor by creating a new chart or editing an existing chart on the dashboard.
In the “Filters” section of your visual mode query:
Add the column you want the control to filter. It must have the same data type as your “Dropdown” control.
Select the appropriate filter operator. If you selected Multiple select in your “Dropdown” settings, use is one of.
Select the dashboard variable of your control.
Select Run query. The result table will update with the new filter applied to the data.
Select Save to dashboard to save the chart.
In a SQL mode query
The syntax for connecting a “Dropdown” control in your SQL mode query varies depending on whether or not you’ve selected Multiple select in the control’s settings.
Single-select “Dropdown”
If Multiple select is deselected, the syntax is simple: {DROPDOWN_NAME}. Replace DROPDOWN_NAME with the name of your control.
Here’s an example of how you might get the total number of Jira work items where the project type is equal to the selected “Dropdown” value:
SELECT COUNT(DISTINCT `Work item`.`issue_id`) AS `Count of unique Work item ID`
FROM `jira_issue` AS `Work item`
INNER JOIN `jira_project` AS `Project`
  ON `Work item`.`project_id` = `Project`.`project_id`
WHERE `Project`.`project_type` = {DROPDOWN_NAME}
Multiple select “Dropdown”
If Multiple select is selected, use the following syntax:
to include data with the selected “Dropdown” values:
{DROPDOWN_NAME.IN('"table_name"."column_name"')}to exclude data with the selected “Dropdown” values:
{DROPDOWN_NAME.NOT_IN('"table_name"."column_name"')}
Replace DROPDOWN_NAME with the name of your control, and make sure to wrap the table-column reference in single quotes. If you’re querying the Atlassian Data Lake, also change the double quotes (") to backticks (`).
Here’s an example of how you might get the total number of Jira work items for all project types selected in the “Dropdown” control:
SELECT COUNT(DISTINCT `Work item`.`issue_id`) AS `Count of unique Work item ID`
FROM `jira_issue` AS `Work item`
INNER JOIN `jira_project` AS `Project`
  ON `Work item`.`project_id` = `Project`.`project_id`
WHERE {DROPDOWN_NAME.IN('`Project`.`project_type`')}
Conversely, here’s an example of how you might get the total number of Jira work items for all project types not selected in the “Dropdown” control:
SELECT COUNT(DISTINCT `Work item`.`issue_id`) AS `Count of unique Work item ID`
FROM `jira_issue` AS `Work item`
INNER JOIN `jira_project` AS `Project`
  ON `Work item`.`project_id` = `Project`.`project_id`
WHERE {DROPDOWN_NAME.NOT_IN('`Jira Project`.`project_type`')}
Verify your chart is connected to the control
To make sure you’ve properly connected your chart to the control, you could verify this by updating the values of the control and seeing if your connected chart filters accordingly.
Alternatively, there are two ways you can check for all charts that are connected to the control.
One option is to:
Hover over the control.
Select its More actions () menu > Highlight connections.
The other option is to:
Select Settings from the dashboard sidebar.
Go to the Controls tab.
Select Highlight connections.
Both options highlight all elements on the dashboard that are connected to that particular control.
Was this helpful?