Preview your schema in visual mode
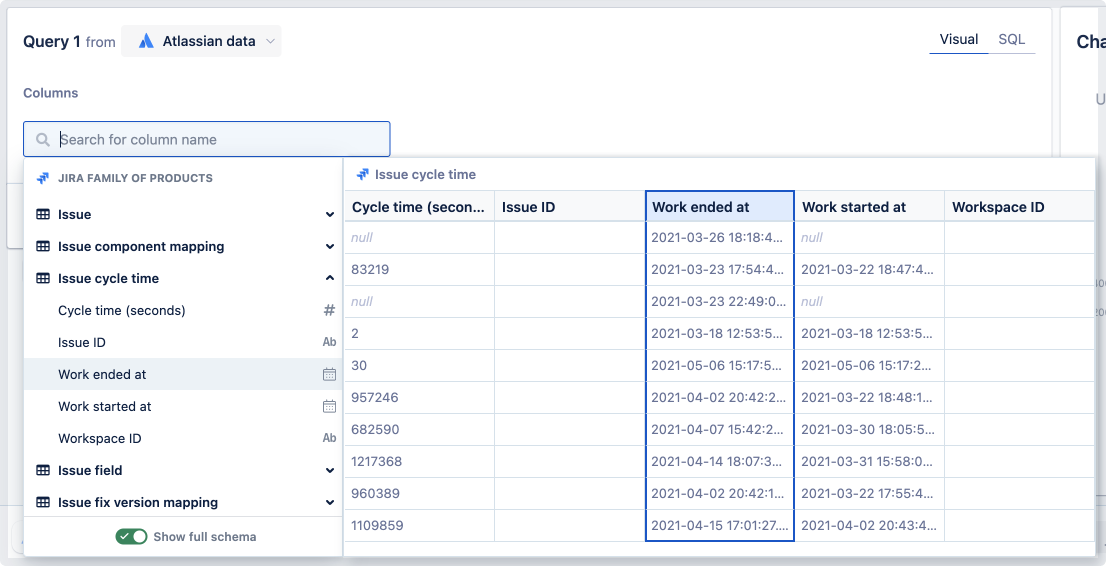
If you want to see the kinds of data stored in a particular table, you can get a convenient table preview with the first ten rows of data. When adding a column or a filter, an interactive table preview will appear in the schema browser when you select a table from the list.
Hovering over any of the table’s columns in the dropdown will highlight the column in the table preview and the dropdown navigation.

Show full schema
Teammates with permission to manage data sources have the ability to hide tables and columns from the schema in its settings. Read more about hiding tables and columns.
You can select Show full schema at the bottom of the schema browser to toggle the visibility of those hidden tables and columns.
Column data types
Each column in the schema browser has an icon corresponding to the column’s data type.
Array
A comma-separated list of values contained within square brackets ([ ])
Boolean
Either a true or false value, where true is 1 and false is 0
Because boolean columns shows true values to 1 and false values to 0 in the result table, boolean columns become number data types after the query.
Date
A date value with the following format: YYYY-MM-DD
An example date value is 2022-05-23.
Datetime
A timestamp value with the following format: YYYY-MM-DD HH:MM:SS.SSS
An example datetime value is 2022-05-23 01:45:09.303.
Number
A numeric value
String
A text value
Was this helpful?
