Audit the run logs of automation rules
Each time a rule is triggered, it saves a log of data that admins can audit to see when the rule was triggered, the status of its execution, and the details of each step the rule attempted to perform.
Admins can view the audit log of an individual rule, or a table of recent activity for all the rules in a space or app. This is an effective way to debug a rule.
Automation audit logs store activity from the past 90 days. Older entries are automatically deleted and can't be recovered.
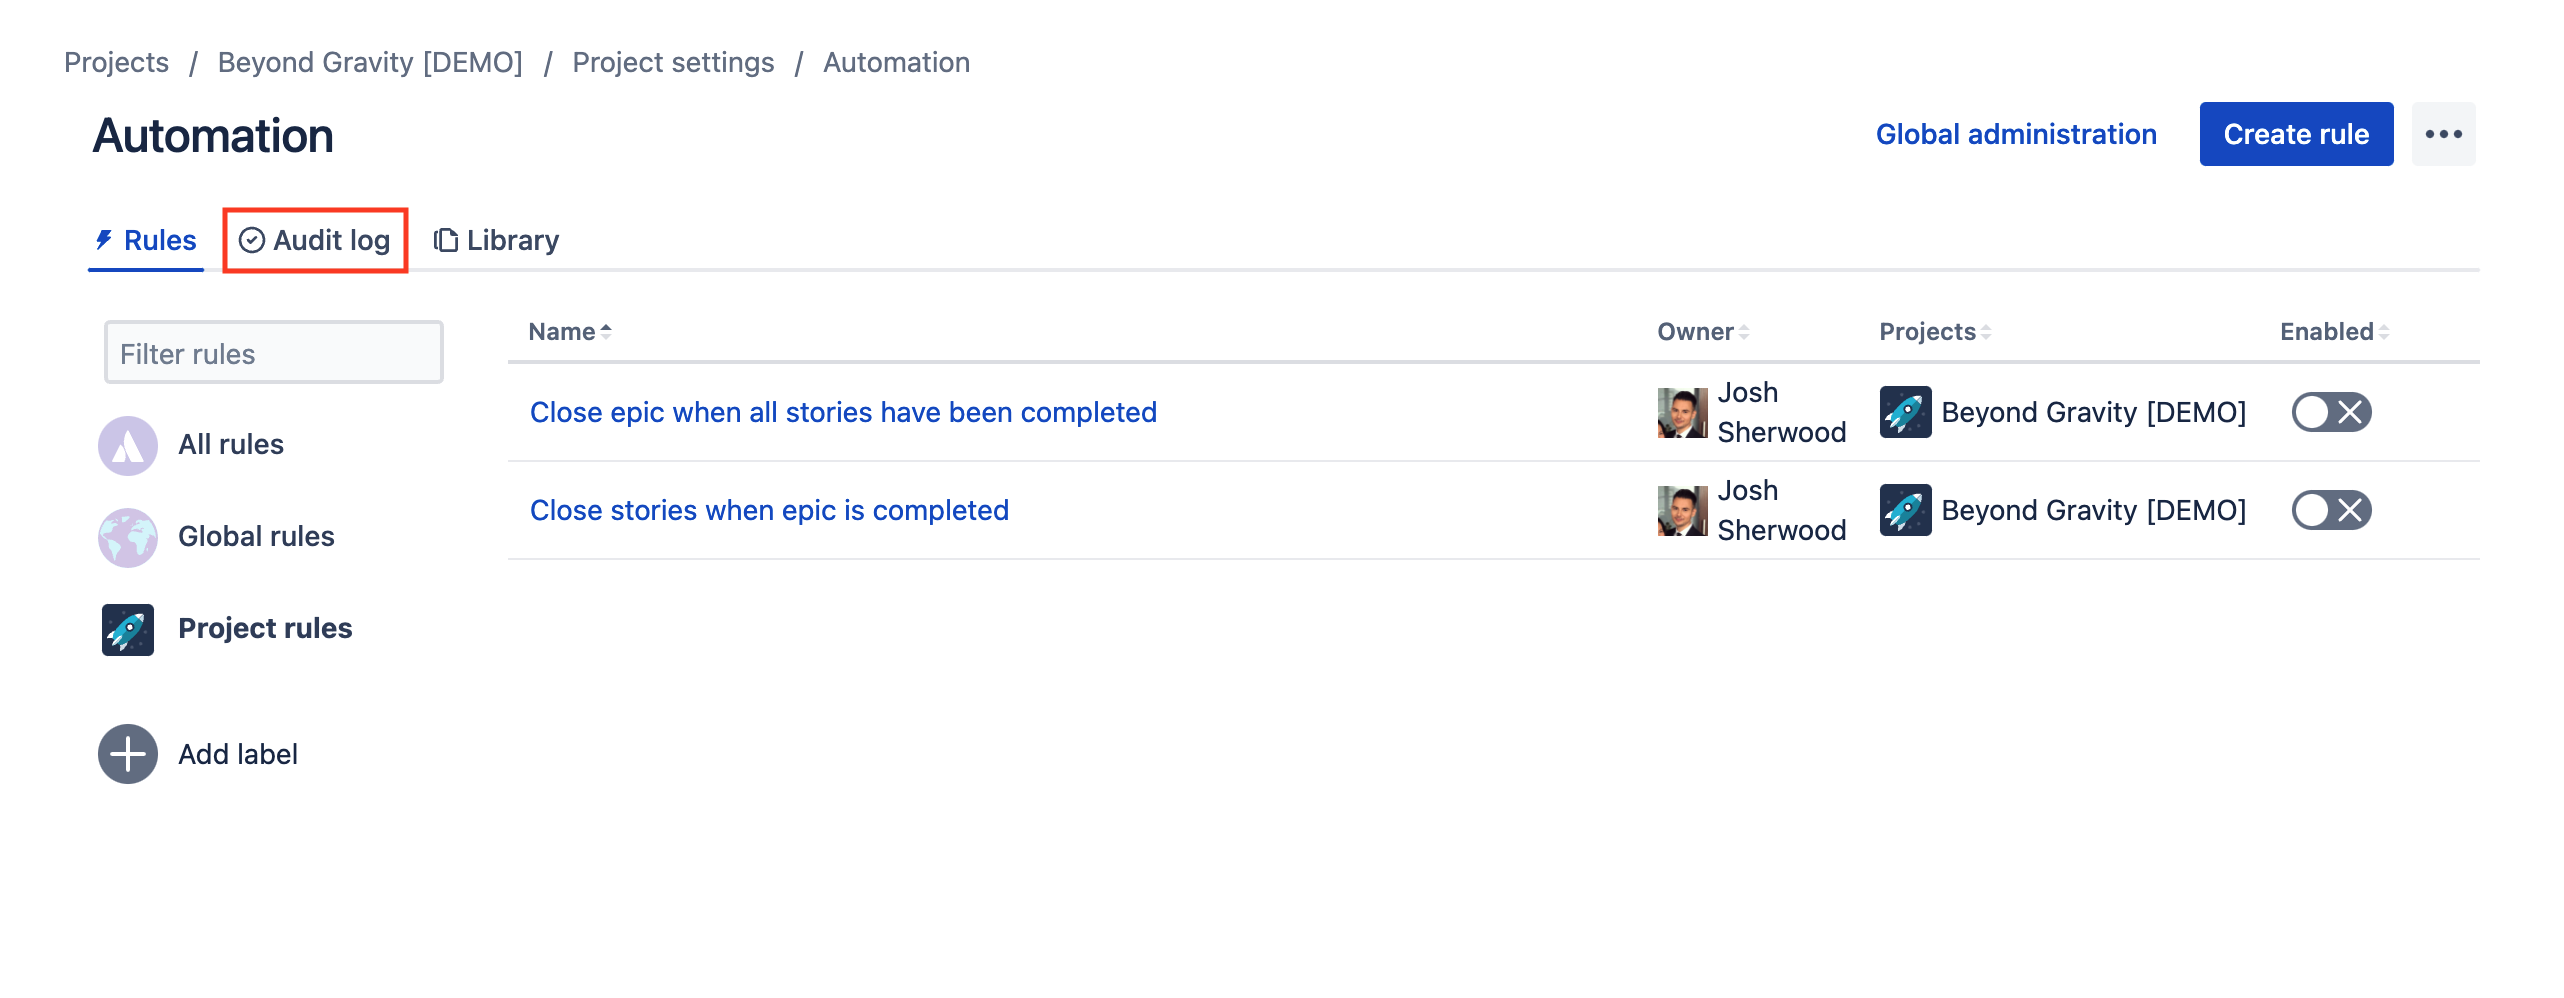
To audit the activity of an individual rule:
Search for a rule by name in the Rules tab, or filter the table by
rule Owner
specific actions, triggers, or advanced components
specific labels
Select the name of a rule to open it
Select the Audit log button, above the Rule details
Select the expand arrow on the far right to view activity of a particular run log
Select the expand arrow beside each step of the rule execution to view
details
run times for each step of the rule
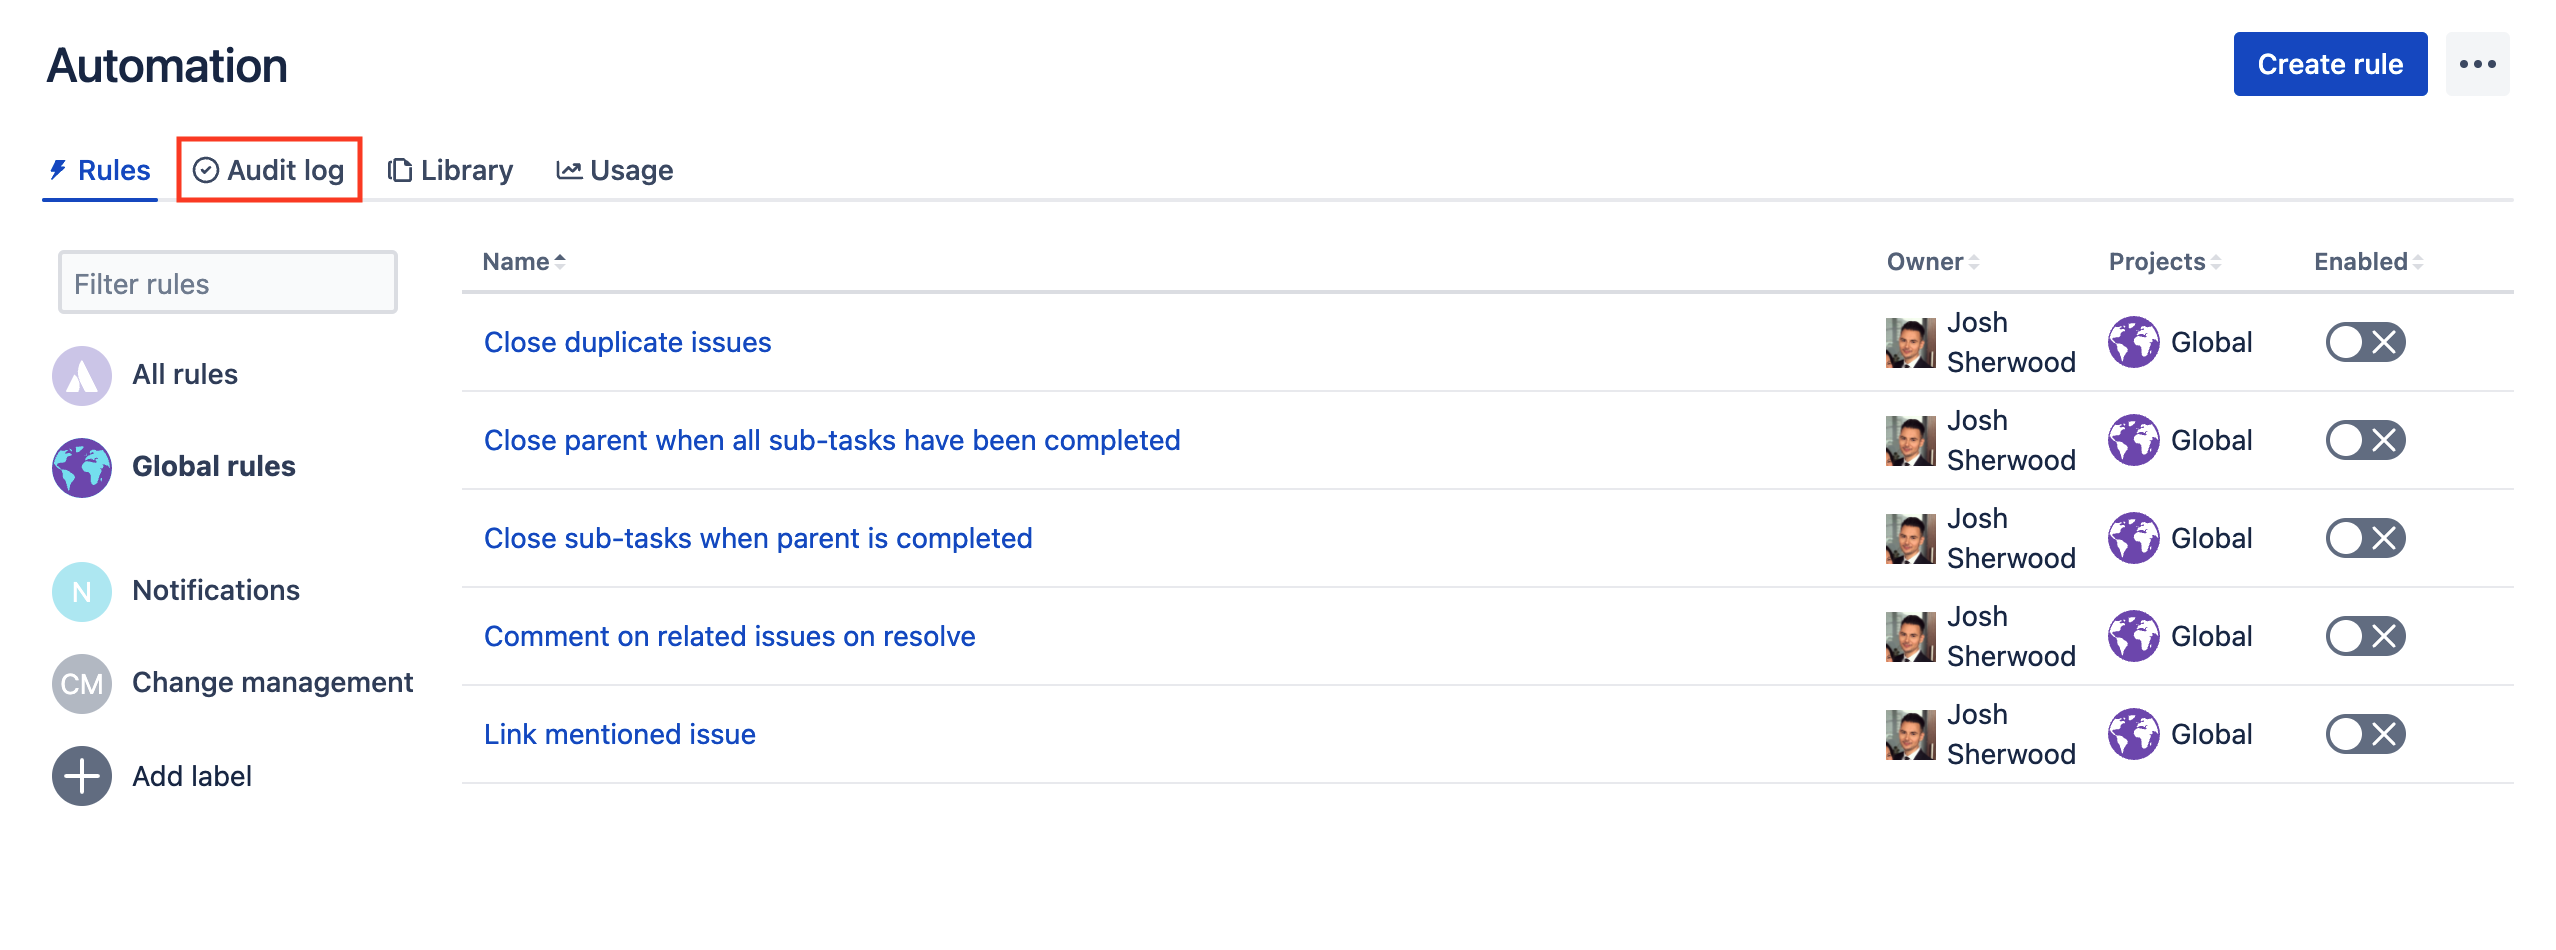
To audit the activity of all rules in the space, or all the rules in an app like Jira and Confluence:
Select the Audit log tab at the top of Automation
Search for a rule by name or filter the table of rules by
Date & time the rule was triggered
Audit log ID of a particular run log
specific actions, triggers, or advanced components
Select either
the Rule name to open that rule’s audit log, or
the expand arrow on the far right to view activity of a particular run log
Select the expand arrow beside each step of the rule execution to view
details and
run times for each step of the rule
Was this helpful?