Preconfigured views in your plan
This page refers to the advanced planning features that are only available as part of Jira Cloud Premium and Enterprise.
Your plan comes with four views that let you slice and dice your data in a variety of different ways to tell your story through the data. Switch between these views using the view selector dropdown menu next to Filters. They are:
You can keep these views as is, or you can use the View settings menu to change how your data displays, show or add columns, add colors, change groupings, and more. See all the ways you can change how your plan looks and what it shows.
For each change you make to a view, an EDITED label appears to indicate that this view has been modified but not saved. To recall this edited view later, you’ll need to save it. Find out how to save a new view.
Basic view
Basic view is the default view for new plans.

How to read this view:
Columns: Start date and due date fields and status
Hierarchy levels set from highest to lowest, per hierarchy configuration
Issues sorted by ranking
Issues colored by status
Timeframe set to Months
Dependency management view
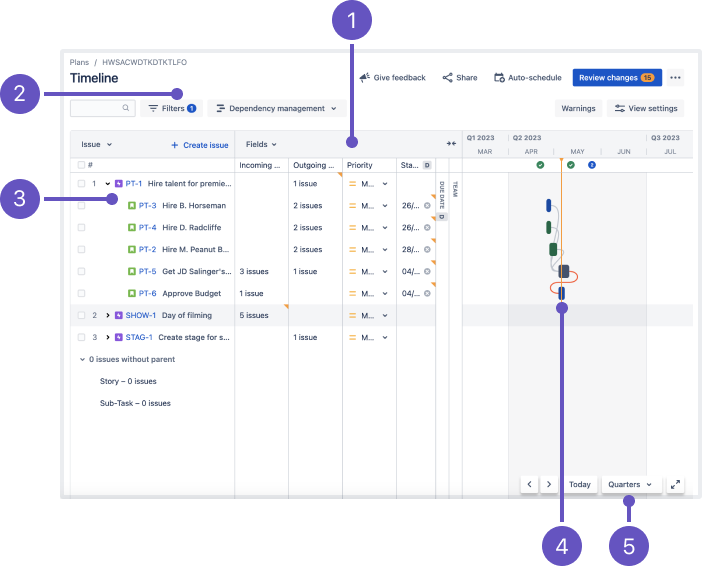
This view focuses only on issues that have dependencies in a plan so you quickly see which ones are blocking the progress of others.
In the screenshot below, some issues don’t match the view’s filters so they appear grayed out in the timeline.

How to read this view:
Columns: Dependencies (incoming and outgoing), priority, start and due date, and team
Hierarchy set from epic to sub-task and filtered by Issues with dependencies
Issues sorted by ranking
Issues colored by status
Timeframe set to Quarters
Top-level planning view
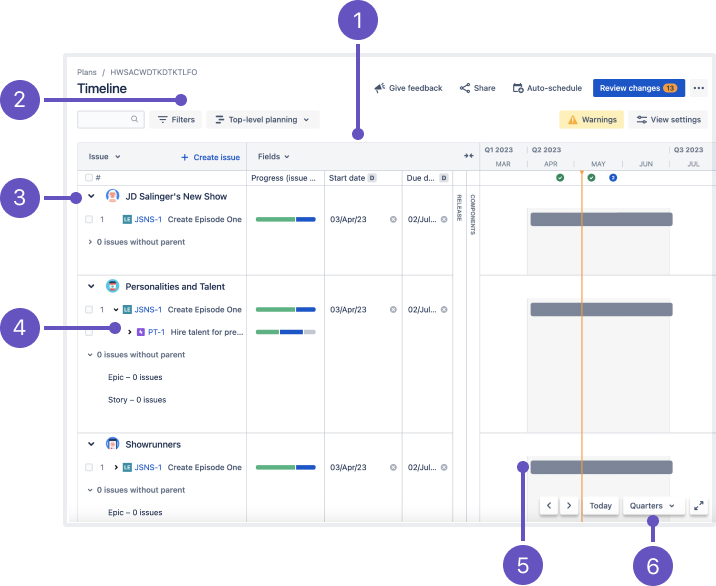
The top-level planning view gives you a high-level view of how work is progressing by showing issues from highest to lowest hierarchy level. You can also see issues in their hierarchical relationship with each other.

How to read this view:
Columns: Progress (issue count), start and due date, release, and component
Hierarchy level set from the highest level to story level, per hierarchy configuration
Issues grouped by projects
Issues sorted by ranking
Issues colored by teams
Timeframe set to Quarters
Sprint capacity management view
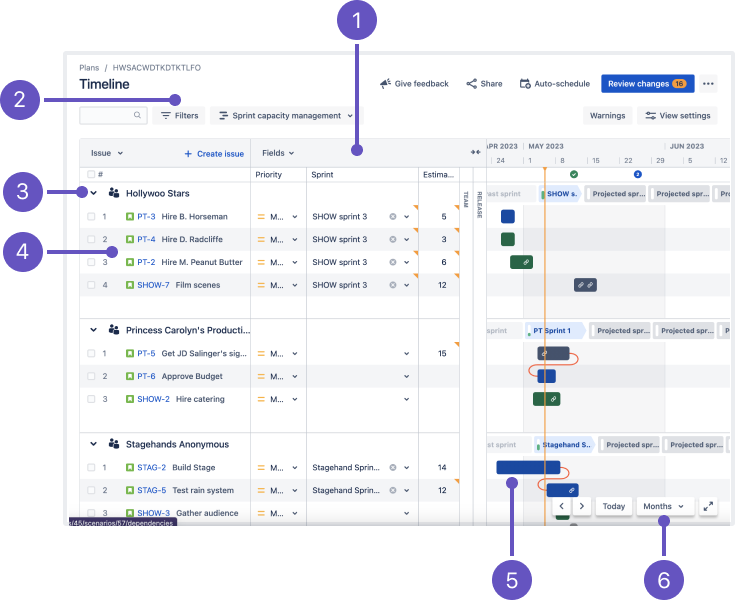
The Sprint capacity management view shows capacity across issues in a plan so you can optimize sprints or iterations.

How to read this view:
Columns: Priority, sprint, story points (estimates), team (collapsed), and release (collapsed)
Hierarchy levels set to Story and issues filtered by All future sprints
Issues grouped by teams with capacity showing in the timeline
Issues sorted by ranking
Issues colored by status
Timeframe set to Months
Was this helpful?