Add a New Relic metric
Statuspage currently only integrates with New Relic APM for generating system metrics. To setup a system metric using New Relic APM, follow the steps below.
Linking New Relic as a 3rd party data source
1. Log in to your New Relic account.
2. Select your user avatar in the upper left corner of your screen.
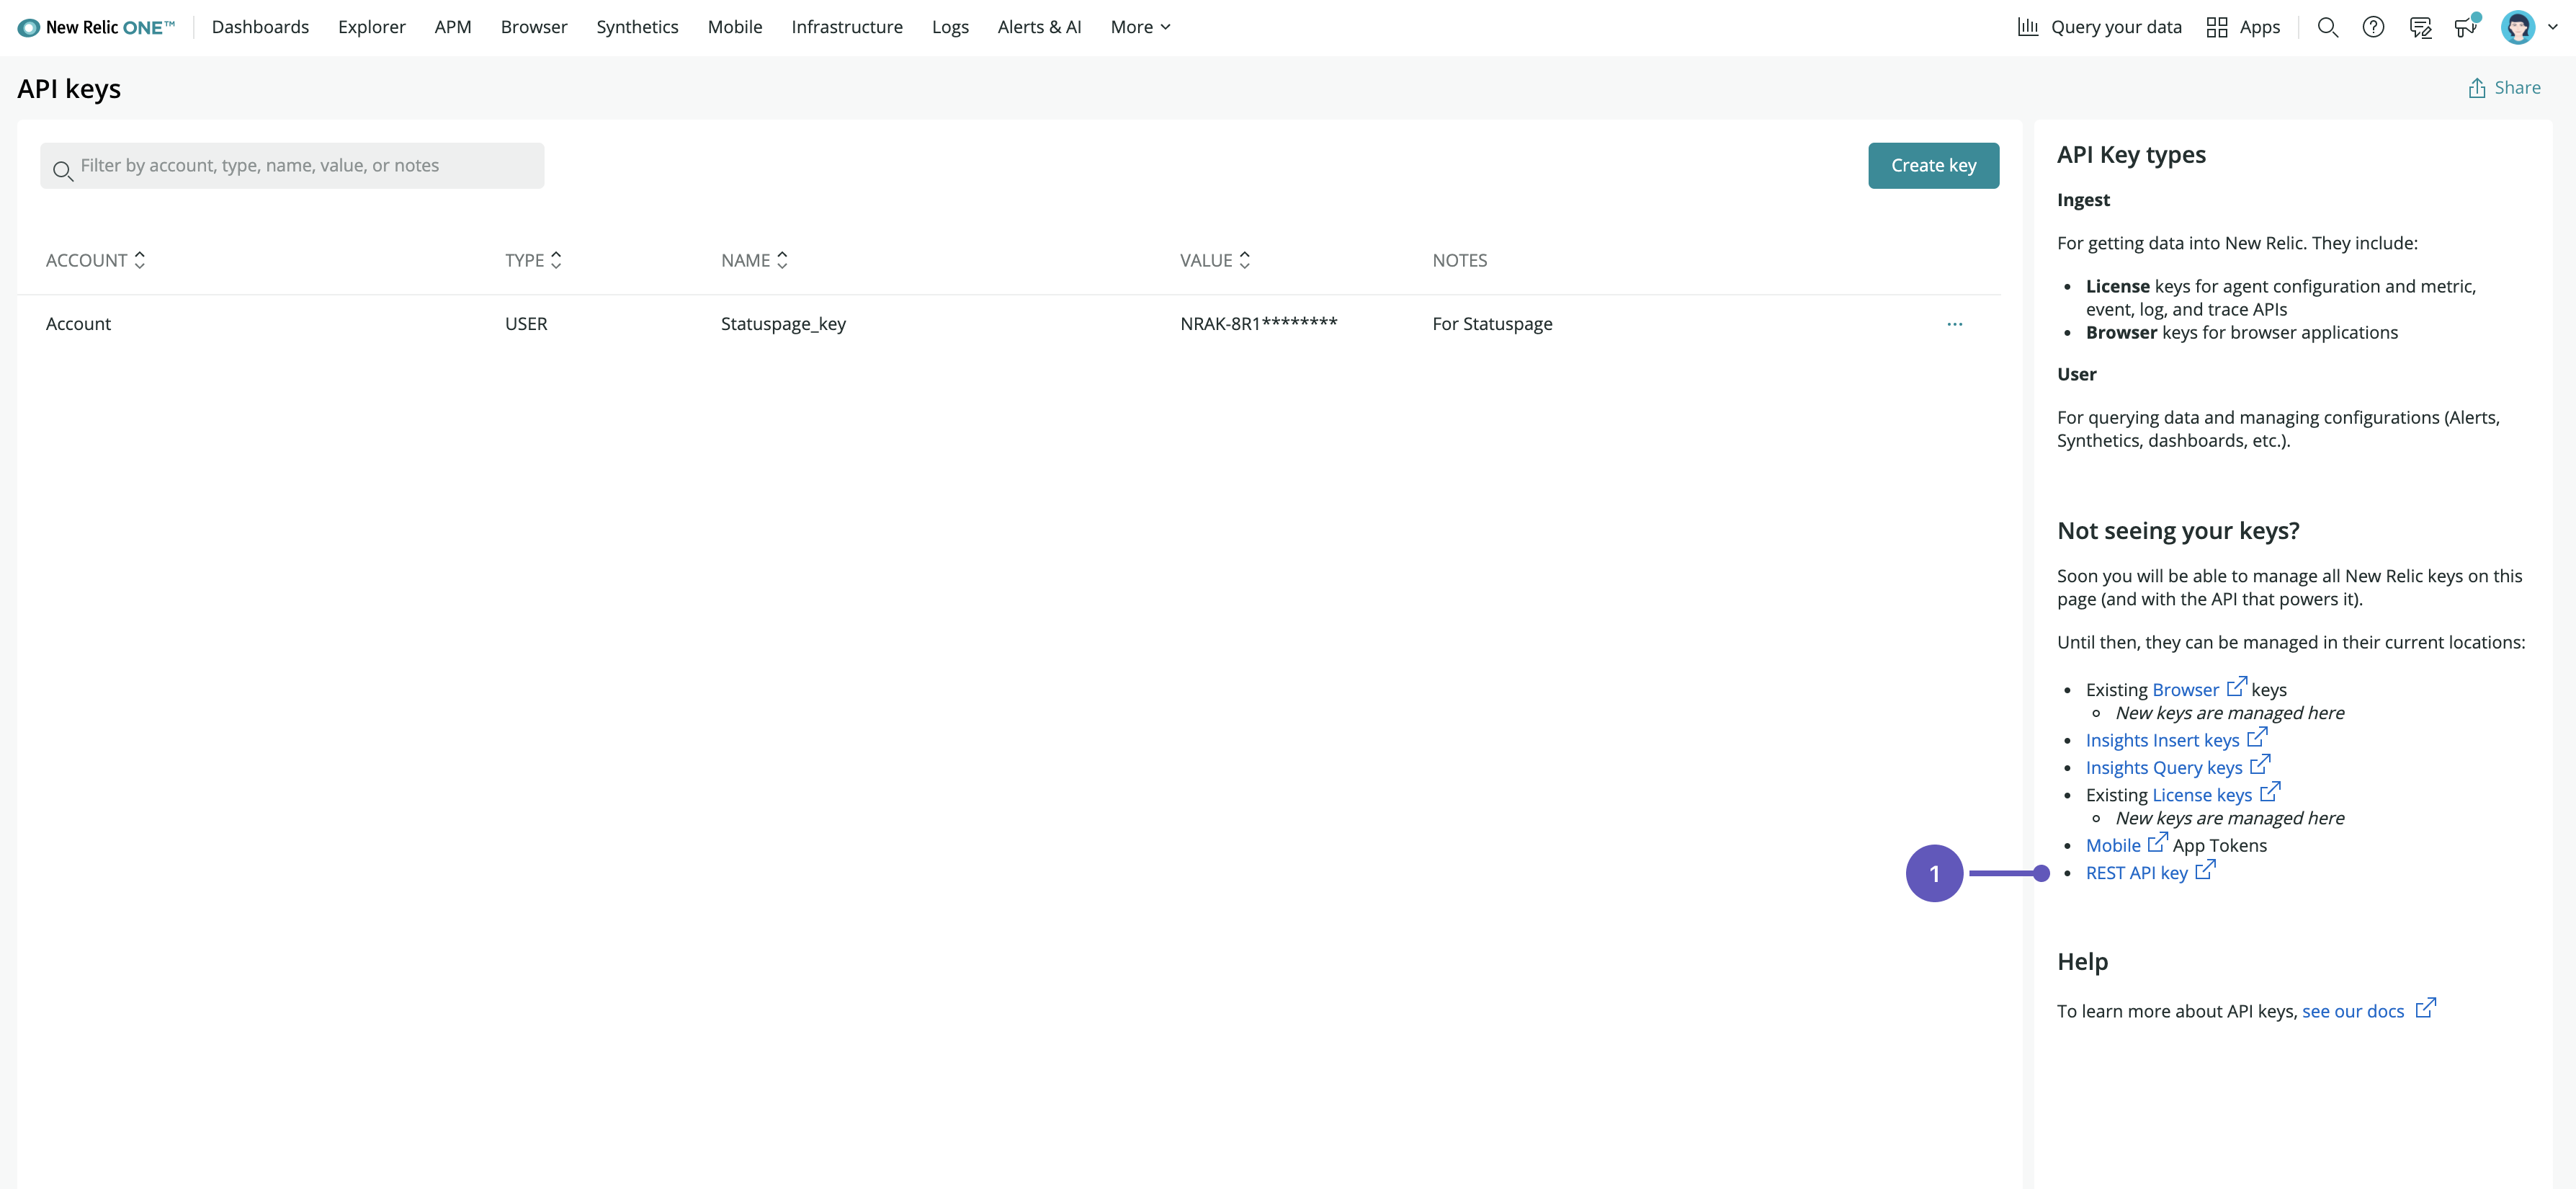
3. Select API keys.
4. View the right-side navigation and locate the link for REST API key (listed under Not seeing your keys?).

5. Click Create key.
6. Click Show key at the top of the page.
6. Copy the API Key at the top of the page (not the Admin User API key).
7. Log in to your Statuspage account.
8. Navigate to System metrics > 3rd party data sources.
9. Select New Relic.
10. Paste in your API key and enter your Metric base uri.
11. Click Link account.
Add a New Relic metric
1. Navigate to System Metrics in your nav bar.
2. Click Add a metric.
3. Select New Relic from the dropdown along with the appropriate Application and Metric.
Available metrics include response time, throughput, apdex, error rate, errors, real user response time, and real user apdex.
4. Enter a display name and display suffix.
5. Click Add metric.
Adding the new metric may take a couple of minutes.
What happens when new components/system metrics are added to audience-specific pages?
If a subscriber hasn't set up their subscription preferences they'll automatically be subscribed to any new components/system metrics.
If a subscriber has already changed their subscription preferences, they will not automatically be added to new components/system metrics. You will need to edit the audience-specific group or user under Audience to give them access to the new component/system metric.
Editing a metric
1. Navigate to Your page > System metrics.
2. Click the Advanced options tab.
3. Edit the metric and its attributes such as suffix, min and max values for the y-axis, and the metric description. By default, your metric is hidden and will not show up on your status page.
4. Click Update Metrics display when you're satisfied with the changes to make them visible to your page viewers.
Check out your page to see your new metric.
Was this helpful?