最適化に関するインサイトと推奨事項を表示する
After connecting to your Data Center instance, we'll automatically start assessing its performance and generating instance optimization insights. It may take up to twenty hours to generate your insights as we collect your data and assess your instance.
最適化のインサイトを表示する
アセスメントを表示するには以下の手順に従います。
In Portfolio insights, open the Apps tab.
Select any Data Center instance.
In the right-hand panel, select View insights. You'll be moved to your instance optimization assessment.
Understand optimization insights
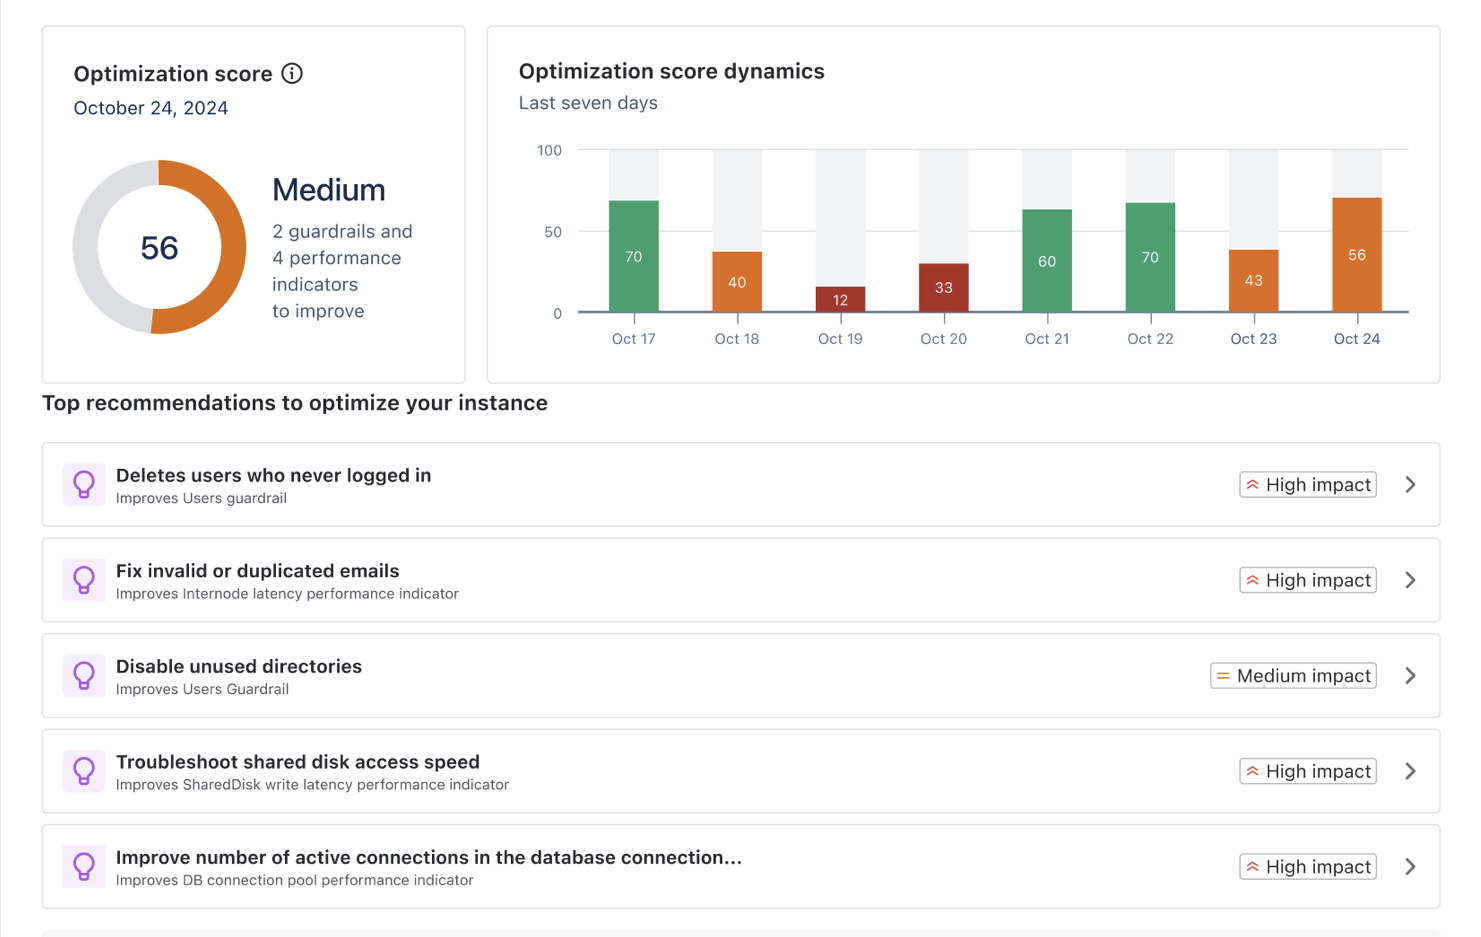
最適化スコア
The Optimization score is a composite metric ranging from 0 to 100, representing your instance's overall health and performance. It's calculated daily at around 3AM Universal Time (UTC) and considers various performance indicators and guardrails.
スコア計算
最適化スコアは次の情報から導き出されます。
製品内診断 (IPD) からのパフォーマンス メトリック
パフォーマンス ログ メトリック
インスタンス設定データ
Data points are collected over a 24-hour period across all nodes in the instance. Each metric is evaluated against predefined thresholds and categorized as Good, Moderate, or Poor. The final score is computed using a weighted sum model that considers:
個々のメトリック スコア
各メトリックの相対的な重要性 (重み)
重要なメトリックのパフォーマンスが悪い場合の調整要因
このアプローチでは、関連するすべての要因が最終スコアに適切に反映され、特に早急な対応が必要なクリティカルな分野に重点が置かれます。
スコアの解釈
スコア範囲 | ステータス | Interpretation |
90-100 | Excellent | Your instance is performing at peak efficiency. Most, if not all, performance metrics and guardrails are well within optimal ranges. Users should experience fast response times and smooth operation across all features. Resource utilization is efficient, with sufficient capacity to handle current loads and short-term growth. The risk of performance-related issues is minimal. |
70-89 | 良い | インスタンスのパフォーマンスは良好であり、ほとんどのメトリックは健全範囲内に収まっています。ユーザーは一般的に応答性の高いシステム動作を経験しますが、一部の複雑な操作ではピーク時にわずかな遅延が見られることがあります。リソース使用率は効果的に管理されていますが、一部のメトリックは推奨上限に近づいている可能性があります。パフォーマンス問題のリスクは低いものの、特に負荷の高い期間には無視できません。 |
50-69 | 中 | インスタンスは最適なレベル以下で動作しており、注意が必要です。複数のパフォーマンス メトリックまたはガードレールが、推奨しきい値に近づいているか、それを超えている可能性があります。ユーザーは一貫性のないパフォーマンスを経験し、特に使用率のピーク時や複雑なタスクでは、さまざまな操作で顕著な遅延が発生することがあります。リソース使用率が高く、追加の負荷や予期しないアクティビティの急増に対応できるキャパシティが限られています。 |
0-49 | 低 | インスタンスのパフォーマンスはきわめて低く、早急に包括的な対応が必要です。複数の重要なパフォーマンス メトリックとガードレールが推奨上限をはるかに超えている可能性があります。ユーザーはさまざまな機能にわたって長い応答時間、タイムアウト、障害などの重大なパフォーマンス問題を頻繁に経験します。リソース使用率は非常に高く、システムは現在の負荷を処理するのに難航し、不安定になったり停止したりするリスクがあります。 |
最適化スコアの内訳
評価では、インスタンスのパフォーマンスが主に次の 2 つのカテゴリに分類されます。
Guardrails status
Monitors key system metrics against recommended maximum values
Helps prevent performance and stability issues before they impact users
Provides early warning when metrics approach or exceed recommended thresholds
パフォーマンス指標
Tracks critical metrics across all instance nodes
Identifies potential bottlenecks and performance risks
Helps maintain optimal user experience
カテゴリー | ステータス | 説明 |
|---|---|---|
ガードレール | APPROACHING LIMIT (上限に接近) | メトリックが推奨しきい値に近づいています。 |
EXCEEDING LIMIT (上限を超過) | Metric has exceeded the recommended threshold | |
重要 | メトリックがしきい値を大幅に超え、深刻なリスクをもたらしています。 | |
パフォーマンス指標 | NEEDS ATTENTION (要注意) | パフォーマンス問題を防ぐために注意が必要です。 |
| REQUIRES ACTION (要アクション) | パフォーマンス問題に対処するために早急のアクションが必要です。 |
Understanding missing metrics
Some metrics might be unavailable in your optimization assessment due to different factors:
Version-specific limitations
For Confluence 8.5-8.7, some infrastructure metrics aren't available:
Local write latency
Synchrony connection state
Node latency
Shared disk write latency
User directory connection latency
These metrics are fully supported from version 8.8 onwards. Since these missing metrics affect the accuracy of the optimization score, we don't display it for Confluence 8.5-8.7. You'll still receive all available metrics and recommendations to help optimize your instance.
Configuration-dependent metrics
Some metrics, such as external user directories, multiple nodes, or collaborative editing, depend on how your instance is configured. Because these are metrics are not applicable for your instance, they won’t imact your optimization score,
Technical limitations
Metrics might be unavailable due to system restrictions, JVM configuration, or other technical factors. These limitations vary based on your environment.
Disabled monitoring configuration
When JMX or Infrastructure Planning Data (IPD) collection is disabled, Portfolio Insights can only access basic system metrics. This limited data affects the accuracy of your optimization score, so we don't display it until both JMX and IPD are enabled. To get complete insights:
Wait for data collection to resume
In all cases, Portfolio insights will continue to provide insights and recommendations based on available metrics. Missing metrics don't prevent you from optimizing your instance - they just focus the optimization on different areas.
上位推奨事項
We highlight the most impactful recommendations at the top of the page. These are actions that, when implemented, are likely to have the greatest positive effect on the performance of your instance.
推奨事項を表示する
When you select guardrail or performance indicator, a detailed panel opens on the right side of the screen. This panel provides:
メトリック名: 測定されているメトリック
ステータス: 現在のステータス (色分けされる)
現在の値としきい値: 実際の値と推奨上限の比較
Node status overview (for performance indicators): Visual representation of the metric across nodes
インサイト: 該当するガードレールの測定内容、最適な値、重要な理由、およびしきい値を超えることによる影響についての簡単な説明
改善に向けた推奨事項:
主な推奨事項と詳細な説明
その他の推奨事項 (該当する場合)
リソース: 関連するドキュメントや識別クエリへのリンク
アクションを実行する
To optimize your instance:
Start with the Top recommendations to optimize your instance section at the top of the page.
Focus on high-impact recommendations first
各推奨事項について、次のようにします。
詳細な説明を読みます。
推奨アクションに従います。
提供されているリソース (ドキュメント、クエリ) を使用して変更を実装します。
Monitor your instance's performance after implementing changes
Remember, some changes may take time to reflect the insights and they are updated daily at UTC+3.
View full list of insights and recommendations
Each instance is unique, and the impact of recommendations may vary based on your specific use case, configuration, and user patterns. We recommend using these insights alongside your own performance monitoring and user feedback.
その他のリソース
インスタンス最適化の詳細については、次のリソースを確認してください。
Optimization insights and recommendations: Learn more about guardrails, performance indicators, and all insights and recommendations.
Security and data handling: Understand how we handle your instance data.
この内容はお役に立ちましたか?