View optimization insights and recommendations
After connecting to your Data Center instance, we'll automatically start assessing its performance and generating instance optimization insights. It may take up to twenty hours to generate your insights as we collect your data and assess your instance.
View optimization insights
To view the assessment:
In Portfolio insights, open the Apps tab.
Select any Data Center instance.
In the right-hand panel, select View insights. You'll be moved to your instance optimization assessment.
Understand optimization insights
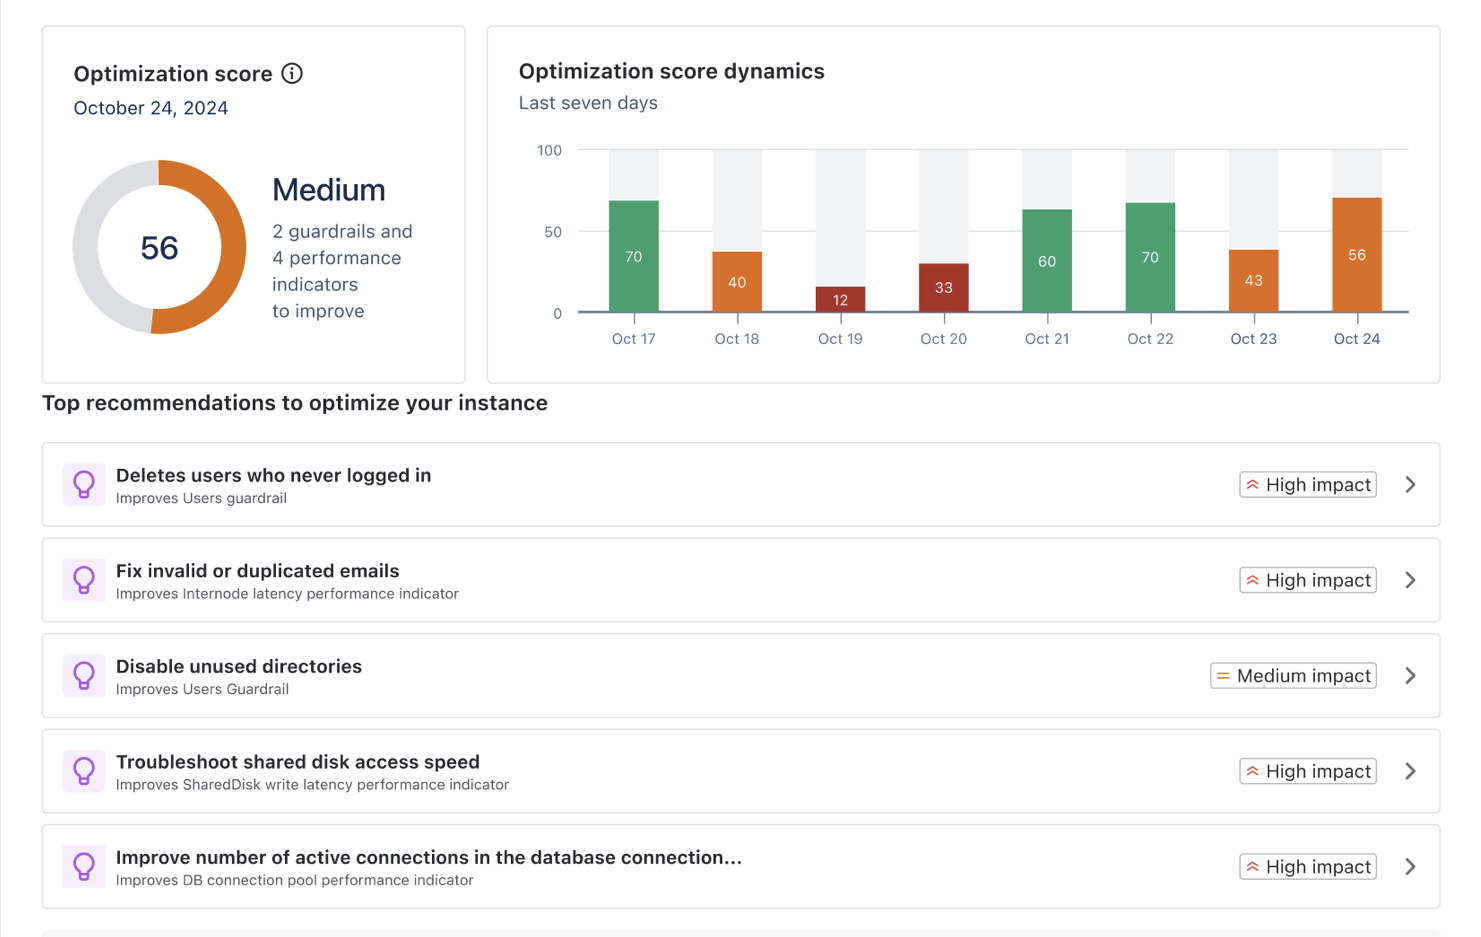
Optimization score
The Optimization score is a composite metric ranging from 0 to 100, representing your instance's overall health and performance. It's calculated daily at around 3AM Universal Time (UTC) and considers various performance indicators and guardrails.
Score calculation
The Optimization score is derived from:
Performance metrics from In-Product Diagnostics (IPD)
Performance log metrics
Instance configuration data
Data points are collected over a 24-hour period across all nodes in the instance. Each metric is evaluated against predefined thresholds and categorized as Good, Moderate, or Poor. The final score is computed using a weighted sum model that considers:
Individual metric scores
The relative importance (weight) of each metric
An adjustment factor for critical metrics performing poorly
This approach ensures that all relevant factors contribute appropriately to the final score, with extra emphasis on critical areas that may need immediate attention.
Score interpretation
Score range | Status | Interpretation |
90-100 | Excellent | Your instance is performing at peak efficiency. Most, if not all, performance metrics and guardrails are well within optimal ranges. Users should experience fast response times and smooth operation across all features. Resource utilization is efficient, with sufficient capacity to handle current loads and short-term growth. The risk of performance-related issues is minimal. |
70-89 | Good | Your instance is performing well, with most metrics in healthy ranges. Users generally experience responsive system behavior, though some complex operations might show slight delays during peak times. Resource utilization is managed effectively, but some metrics may be approaching their upper recommended limits. The risk of performance issues is low but not negligible, particularly during high-load periods. |
50-69 | Medium | Your instance is operating below optimal levels and requires attention. Multiple performance metrics or guardrails are likely approaching or exceeding recommended thresholds. Users may experience inconsistent performance, with noticeable delays in various operations, especially during peak usage or for complex tasks. Resource utilization is high, with limited capacity to handle additional load or unexpected spikes in activity. |
0-49 | Low | Your instance is in a severely degraded state and requires immediate, comprehensive attention. Multiple critical performance metrics and guardrails are likely well beyond recommended limits. Users are experiencing frequent, significant performance issues, including extended response times, timeouts, or failures across various features. Resource utilization is extremely high, with the system struggling to handle current loads and at risk of instability or outages. |
Optimization score breakdown
The assessment breaks down your instance's performance into two main categories:
Guardrails status
Monitors key system metrics against recommended maximum values
Helps prevent performance and stability issues before they impact users
Provides early warning when metrics approach or exceed recommended thresholds
Performance indicators
Tracks critical metrics across all instance nodes
Identifies potential bottlenecks and performance risks
Helps maintain optimal user experience
Category | Status | Description |
|---|---|---|
Guardrails | Approaching limit | Metric is nearing the recommended threshold |
Exceeding limit | Metric has exceeded the recommended threshold | |
Critical | Metric has significantly exceeded the threshold, posing severe risks | |
Performance indicators | Needs attention | Metric requires attention to prevent performance issues |
| Requires action | Metric requires immediate action to address performance issues |
Understanding missing metrics
Some metrics might be unavailable in your optimization assessment due to different factors:
Version-specific limitations
For Confluence 8.5-8.7, some infrastructure metrics aren't available:
Local write latency
Synchrony connection state
Node latency
Shared disk write latency
User directory connection latency
These metrics are fully supported from version 8.8 onwards. Since these missing metrics affect the accuracy of the optimization score, we don't display it for Confluence 8.5-8.7. You'll still receive all available metrics and recommendations to help optimize your instance.
Configuration-dependent metrics
Some metrics, such as external user directories, multiple nodes, or collaborative editing, depend on how your instance is configured. Because these are metrics are not applicable for your instance, they won’t imact your optimization score,
Technical limitations
Metrics might be unavailable due to system restrictions, JVM configuration, or other technical factors. These limitations vary based on your environment.
Disabled monitoring configuration
When JMX or Infrastructure Planning Data (IPD) collection is disabled, Portfolio Insights can only access basic system metrics. This limited data affects the accuracy of your optimization score, so we don't display it until both JMX and IPD are enabled. To get complete insights:
Wait for data collection to resume
In all cases, Portfolio insights will continue to provide insights and recommendations based on available metrics. Missing metrics don't prevent you from optimizing your instance - they just focus the optimization on different areas.
Top recommendations
We highlight the most impactful recommendations at the top of the page. These are actions that, when implemented, are likely to have the greatest positive effect on the performance of your instance.
View recommendations
When you select guardrail or performance indicator, a detailed panel opens on the right side of the screen. This panel provides:
Metric name: The metric being measured
Status: Current status with color coding
Current value and threshold: Your value compared to the recommended limit
Node status overview (for performance indicators): Visual representation of the metric across nodes
Insight: A brief explanation of what this guardrail measures, its optimal value, why it's important, and the impact of exceeding the threshold
Recommendations to improve:
Primary recommendation with detailed explanation
Additional recommendations (if applicable)
Resources: Links to relevant documentation and identification queries
Taking action
To optimize your instance:
Start with the Top recommendations to optimize your instance section at the top of the page.
Focus on high-impact recommendations first
For each recommendation:
Read the detailed explanation
Follow the recommended actions
Use the provided resources (documentation, queries) to implement changes
Monitor your instance's performance after implementing changes
Remember, some changes may take time to reflect the insights and they are updated daily at UTC+3.
View full list of insights and recommendations
Each instance is unique, and the impact of recommendations may vary based on your specific use case, configuration, and user patterns. We recommend using these insights alongside your own performance monitoring and user feedback.
Additional resources
To learn more about instance optimization, check out these resources:
Optimization insights and recommendations: Learn more about guardrails, performance indicators, and all insights and recommendations.
Security and data handling: Understand how we handle your instance data.
Was this helpful?