Create "Dropdown" control from an array custom field in Atlassian Analytics
Platform Notice: Cloud Only - This article only applies to Atlassian apps on the cloud platform.
Summary
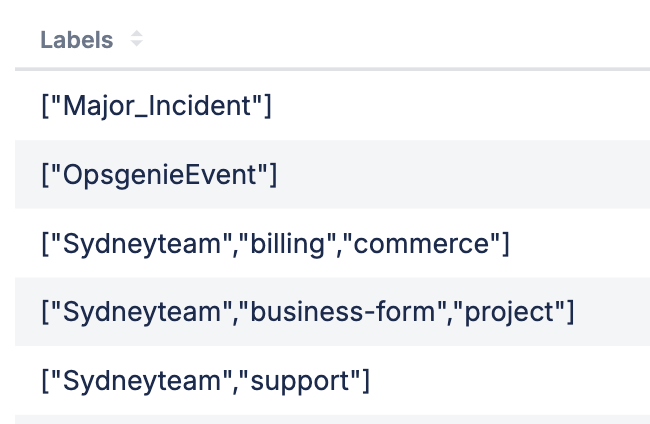
When you have a custom field that contains an array of values, as the field can hold multiple values on the Jira work item, you may need to use the control editor when creating a “Dropdown” control for the field.
This article will explain how to make a “Dropdown” control from a field that contains an array of values to show A, B, C and not [A], [A,B], [B,C].
Solution
Create a dropdown control with a visual mode query
Open your dashboard
Select Control > Dropdown from the sidebar
Once the Dropdown control pop-up appears, select Switch to control editor
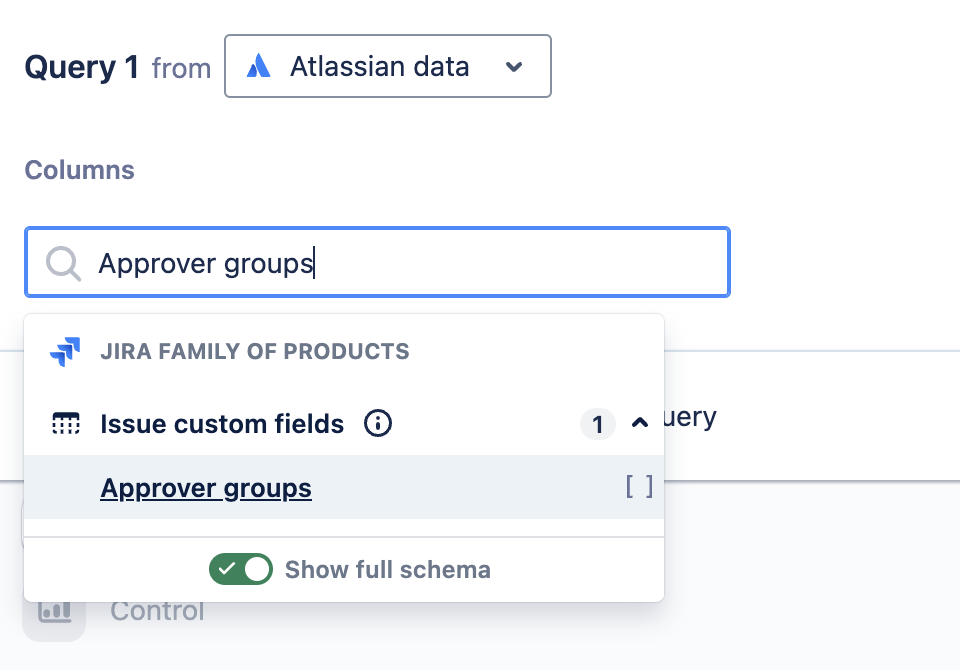
Expand the Issue custom fields table to select your custom field or search for the field by its name in the search bar
Add the custom field to your query
The search interface will look like the following screenshot:
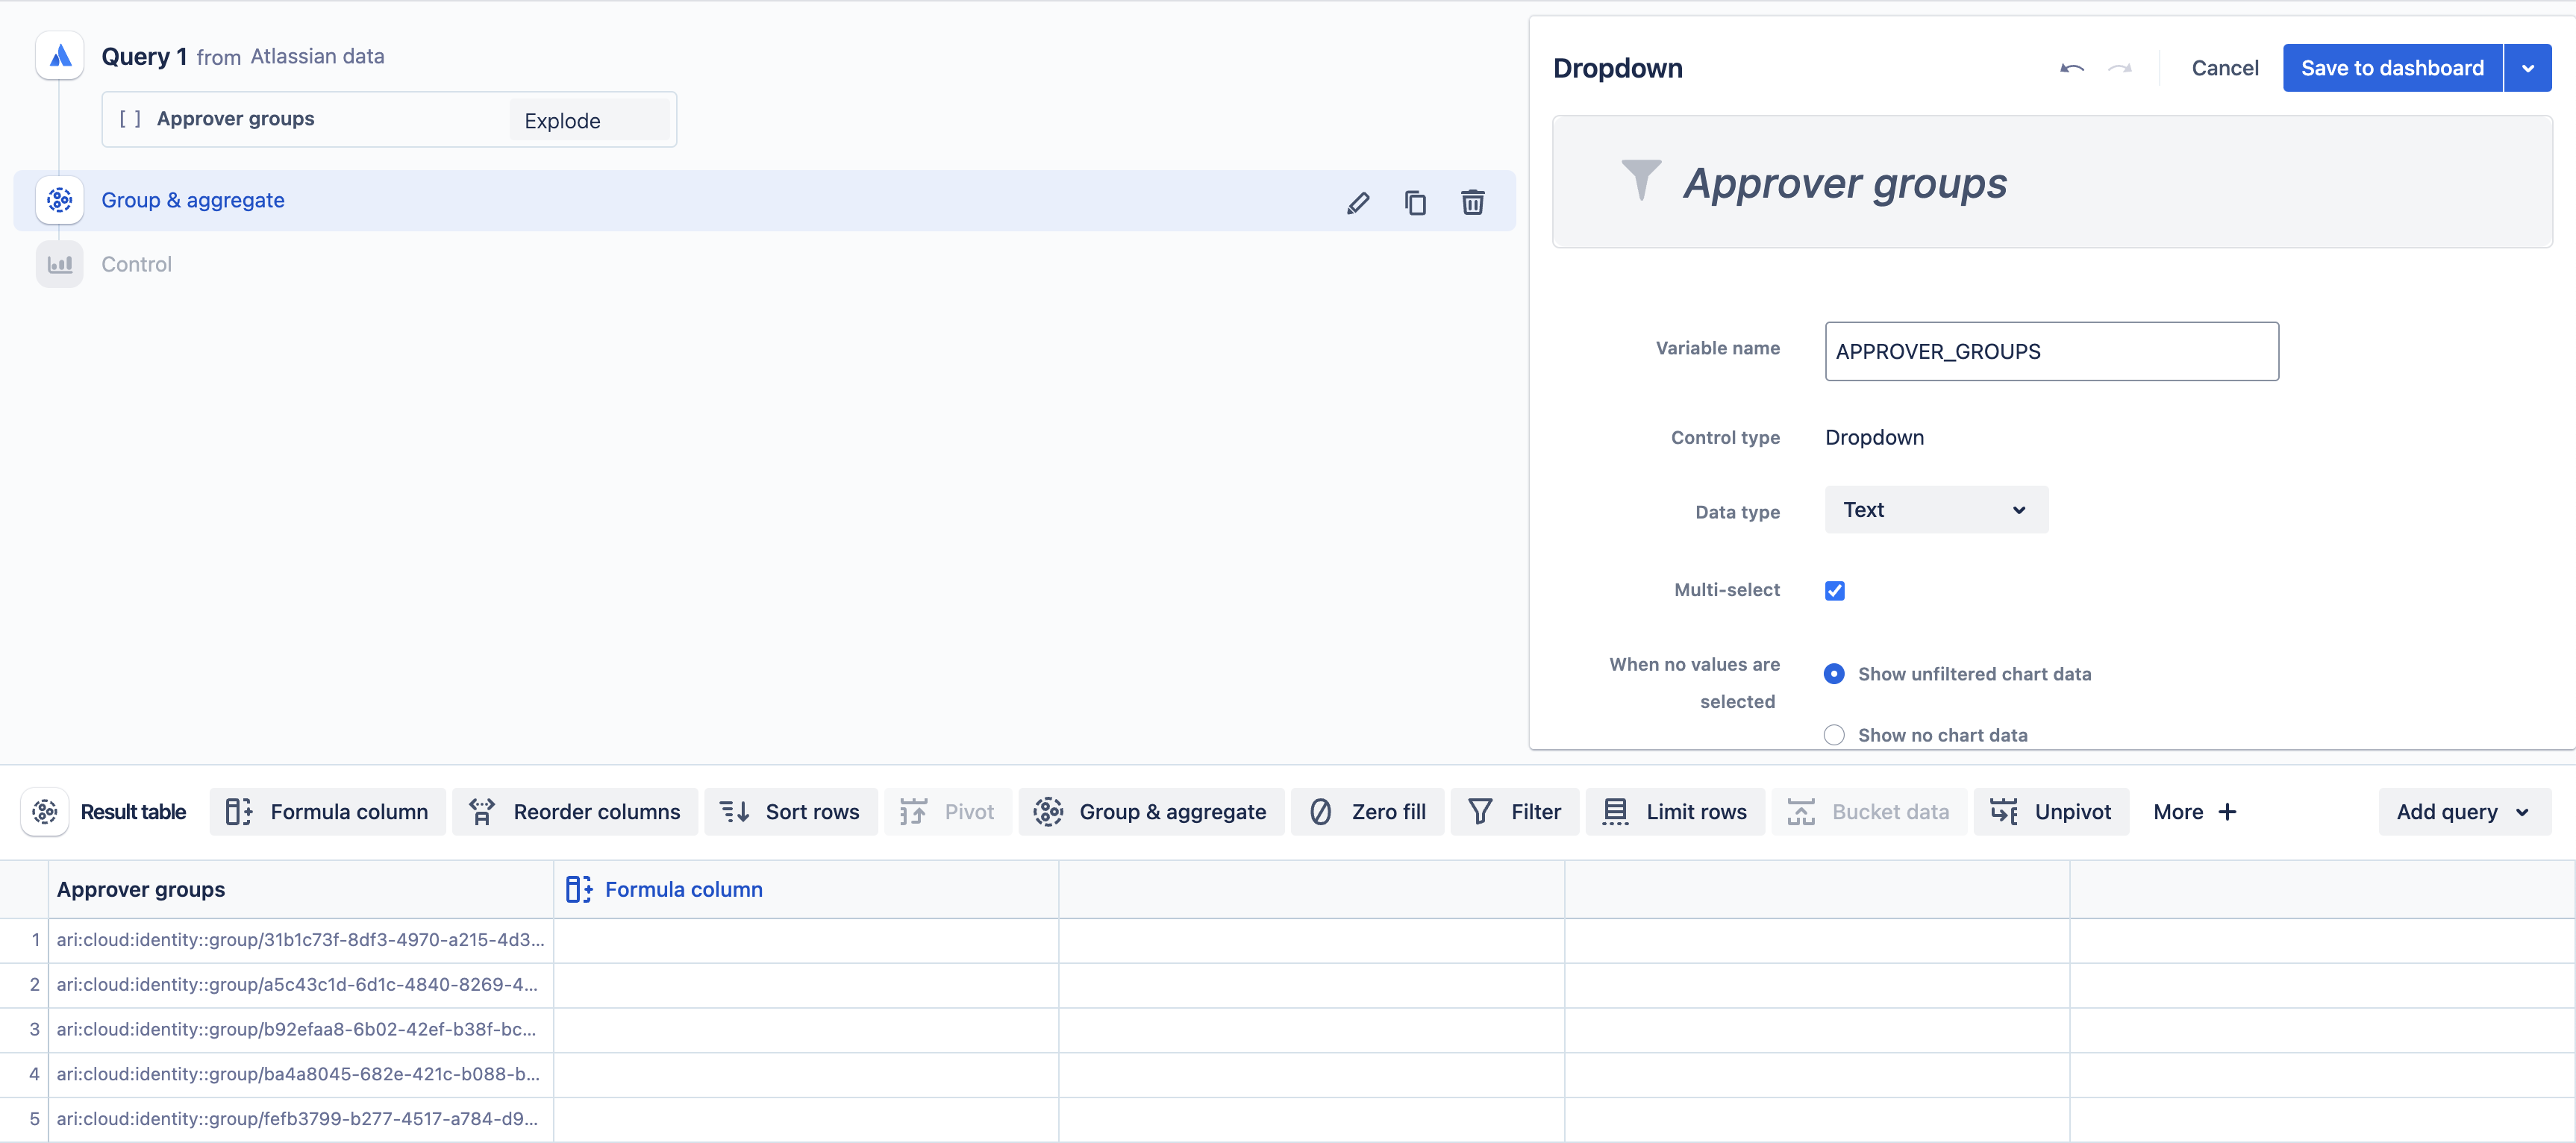
Change the column to use the ‘Explode’ Group function, then run the query
If you receive a warning message about the array column needing to have unique values, you can add a Group & aggregate step to group the data into one row per value
Configure your “Dropdown” control settings, then save the control to the dashboard
Once complete, your "Dropdown" control will appear in your dashboard as seen below:
Since this control is created within the control editor, you’ll need to manually connect the control in your chart(s) using the appropriate filter operator for array data.
Create a dropdown control with a SQL mode query
Open your dashboard
Select Control > Dropdown from the sidebar
Once the “Dropdown” control pop-up appears, select Switch to control editor
After the control editor opens, toggle to SQL Mode
Paste the code below into your SQL query.
Note: you’ll need to replace
<your_custom_field_key>with the key of the custom field that you want to queryWITH table as( SELECT EXPLODE(SPLIT(REPLACE(REPLACE(a.value, "[", ""), "]", ""), ', ')) AS Value FROM jira_issue_field AS a WHERE (a.field_key = <'your_custom_field_key'>) AND a.value IS NOT NULL GROUP BY Value ORDER BY Value ASC)SELECT * FROM tableGROUP BY Value
Run the query
Then Save your “Dropdown” control to the dashboard.
Since this control is created within the control editor, you’ll need to manually connect the control in your chart(s). Keep in mind that the array formatting like [“value 1”, “value 2”] has been removed from your field’s values within the “Dropdown” control and would need to be replicated within your chart before you’ll be able to successfully use the control to filter the chart.
Was this helpful?