Bitbucket Pipelines build fails: "Container 'Build' exceeded memory limit"
Platform Notice: Cloud Only - This article only applies to Atlassian apps on the cloud platform.
Summary
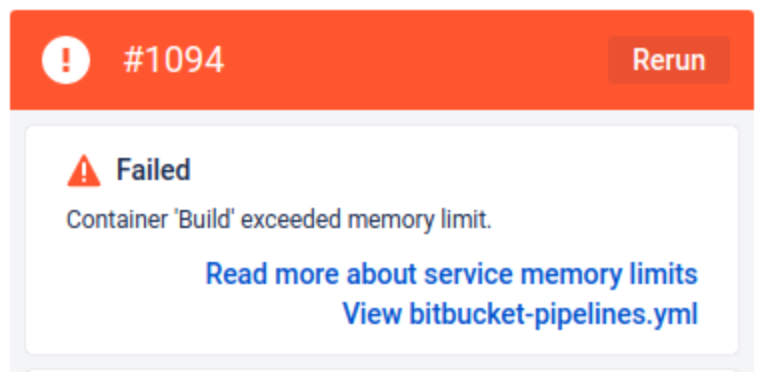
Your Bitbucket Pipelines build fails. The following error shows on the build page, next to the build log, as seen in the screenshot:
"Container 'Build' exceeded memory limit."
There are 2 possible scenarios for this case:
Generic Scenario
Builds using Jest Test Framework are slow or frequently hang (based on the Pipeline build minutes consumption) or fail with Container “Build” exceeded memory limit error
See below for possible causes and troubleshooting steps
Solution
By default, the build container of a Pipelines step is allocated 4 GB of memory, unless you have specified a different step size in your bitbucket-pipelines.yml. If a Pipelines step is using services, the build container will have less memory than that, because some of the step's memory is allocated to the service containers (see more details on the services page).
Scenario 1: Generic scenario
Possible causes:
The build requires more than the allowed build container memory
Troubleshooting Steps:
Debug the build locally using the instructions on Debug pipelines locally with the Docker page. We recommend debugging the build locally on a Linux machine to more closely simulate the Pipelines environment. Does the build fail locally with a similar memory error?
If YES:
Add the following commands in your bitbucket-pipelines.yml, at the beginning of the script in the Pipelines step that fails with this error. These commands will print memory usage per process during the step, in the build log of this step. This can help to narrow down the issue, identify the culprit, and take action.
- while true; do echo "Memory usage in bytes:" && cat /sys/fs/cgroup/memory.current; echo "Swap memory usage in bytes:" && cat /sys/fs/cgroup/memory.swap.current; sleep 2; done &
- while true; do date && ps aux && echo "" && sleep 2; done &
Configure your tooling to utilise explicitly defined limits, e.g. java -Xms512m -Xmx2048, that are within the limit of the build container's memory.
Increase the allocated memory (using the size attribute) for the Pipeline step that fails with this error, and check if you are still getting the memory-related issue. Refer to Databases and service containers page for more information on memory allocation in Pipelines.
Note: Opting for larger step sizes may impact billing.
If NO:
If your build is using the Jest Test Framework, read the section below to troubleshoot the issue further. Otherwise, raise a
Support Ticket and share the Pipeline build URL from http://bitbucket.org.
.
Scenario 2: Builds using Jest Test Framework are slow or frequently hang (based on the Pipeline build minutes consumption) or fail with Container “Build” exceeded memory limit error
Possible cause:
A large number of workers running concurrently
Troubleshooting Steps:
Add the following commands in your bitbucket-pipelines.yml, at the beginning of the script in the Pipelines step that fails with this error. These commands will print memory usage per process during the step, in the build log of this step.
- while true; do ps -aux && sleep 5; done &
- while true; do echo "Memory usage in megabytes:" && echo $((`cat /sys/fs/cgroup/memory.current | awk '{print $1}'`/1048576)) && sleep 0.1; done &
The output of the process list will show how many workers are running when the build is slow or when it gets OOM (Out of Memory). You can see the CPU and Memory Usage along with the worker process.
Does the output show around 4-7 worker processes with high CPU / Memory usage?
If YES:
JEST by default creates 7 child workers, and the daemon process that calls the Jest Test assigns the memory to each of these Jest workers. If you have up to 2 GB per worker (as an example) configured, and all 7 of these workers are running concurrently, it could easily reach OOM (Out of Memory). This can result in the build running slowly or appearing stalled as the build container doesn’t have enough memory allocated. To fix the issue, take the following steps:
Add this command
--maxWorkers=2to your build command to limit the number of workers to 2.Alternatively, you should be able to define it in package.json or in jest config as mentioned on Configuring Jest page.
If NO:
Raise a Support Ticket and share the Pipeline build URL from bitbucket.org.
Was this helpful?