Query data on Teams with Atlassian Analytics
Platform Notice: Cloud Only - This article only applies to Atlassian apps on the cloud platform.
Summary
Please note: We're in the process of changing from "Issue" to "Work item" to refer to a single piece of work in Jira. You may see either or both of these terms used in your apps while we're rolling out this change.
This article has a few examples of how to query your Atlassian team data within Atlassian Analytics. The “Team” table in the Atlassian Data Lake holds information about your team(s), such as the team name, team description, membership setting, status, team ID, and more. The “Team member” table has information about the individual users that belong to each Atlassian team.
Throughout this article, we’ll cover two different examples of how to query your Atlassian team data. The first example is how to query the number of issues assigned to a team. The second example is how to query the users added to a specific team.
Solution
Query total issues assigned to a team
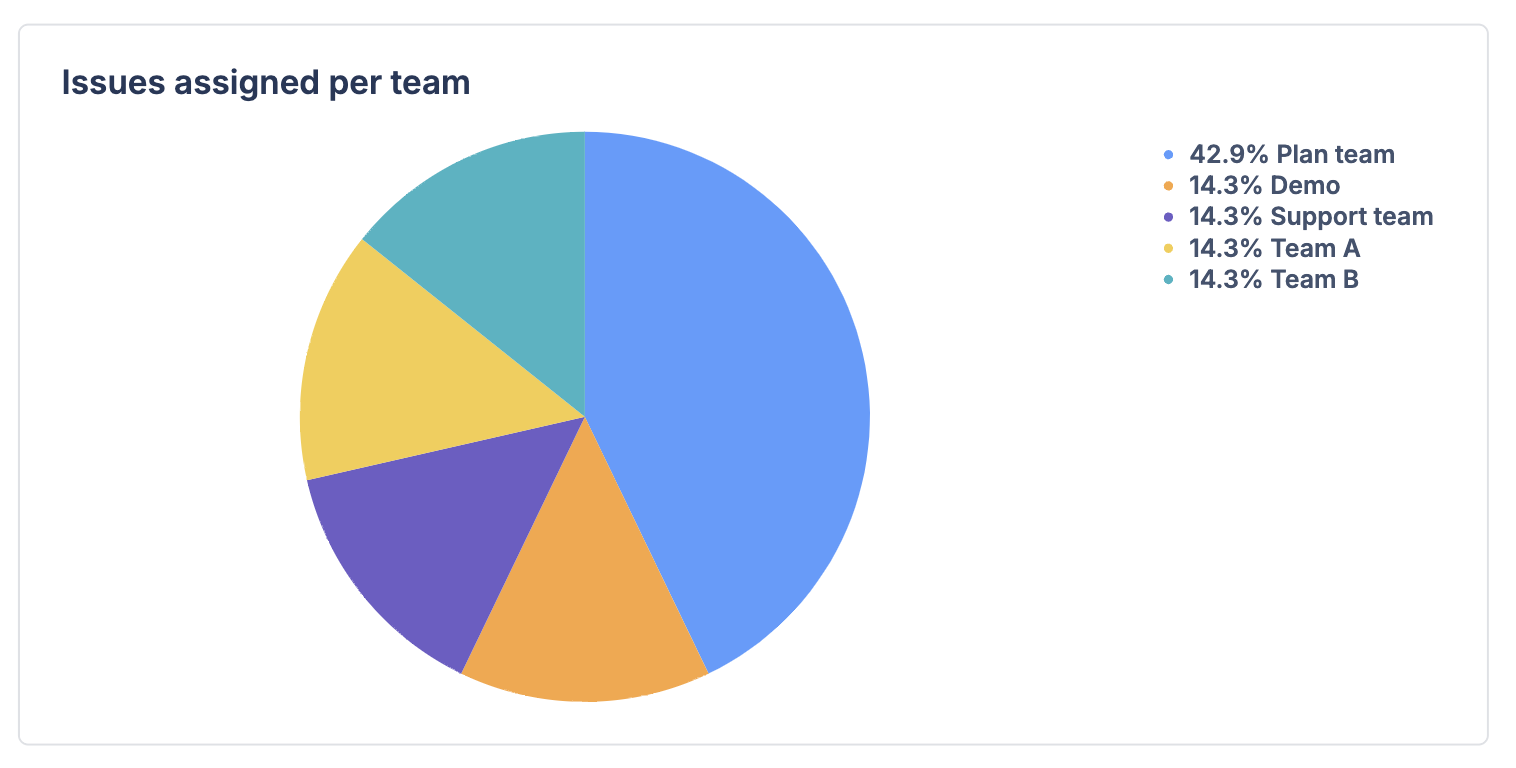
In this example, we’ll query the number of issues a team is assigned through the “Team Picker (single team)” field named 'Team.'
Select Create > Chart > Custom chart from the global navigation to start with a blank visual mode query
Add the following columns to your query:
The Issue key column from the Issue table under “Jira family of products” and use the ‘Count of unique’ aggregation
The Name column from the Team table, which will use the 'Group' grouping
Optional: Rename the “Count of unique Issue key” column to “Issues”
Run the query
You will see the results displayed in a pie chart similar to the following:
Query teams and users per team
Select Create > Chart > Custom chart from the global navigation to start with a blank visual mode query
Add the following columns to your query:
The Name column from the Team table and group the column
The Name column from the Account table and Group the column
Run the query
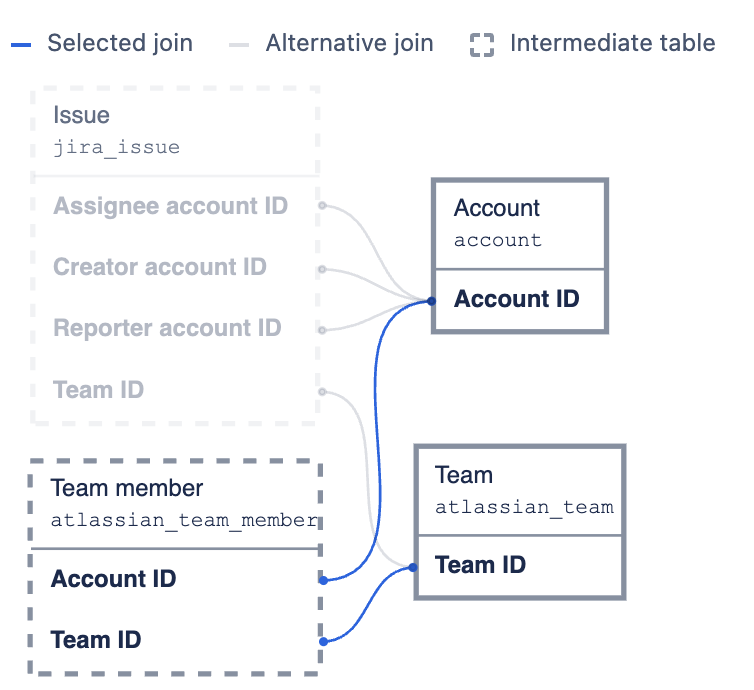
If you don’t want any additional columns added to the query, ensure that the join path used to connect the Team and Account tables is routed through the “Team member” table, as shown in the screenshot below.
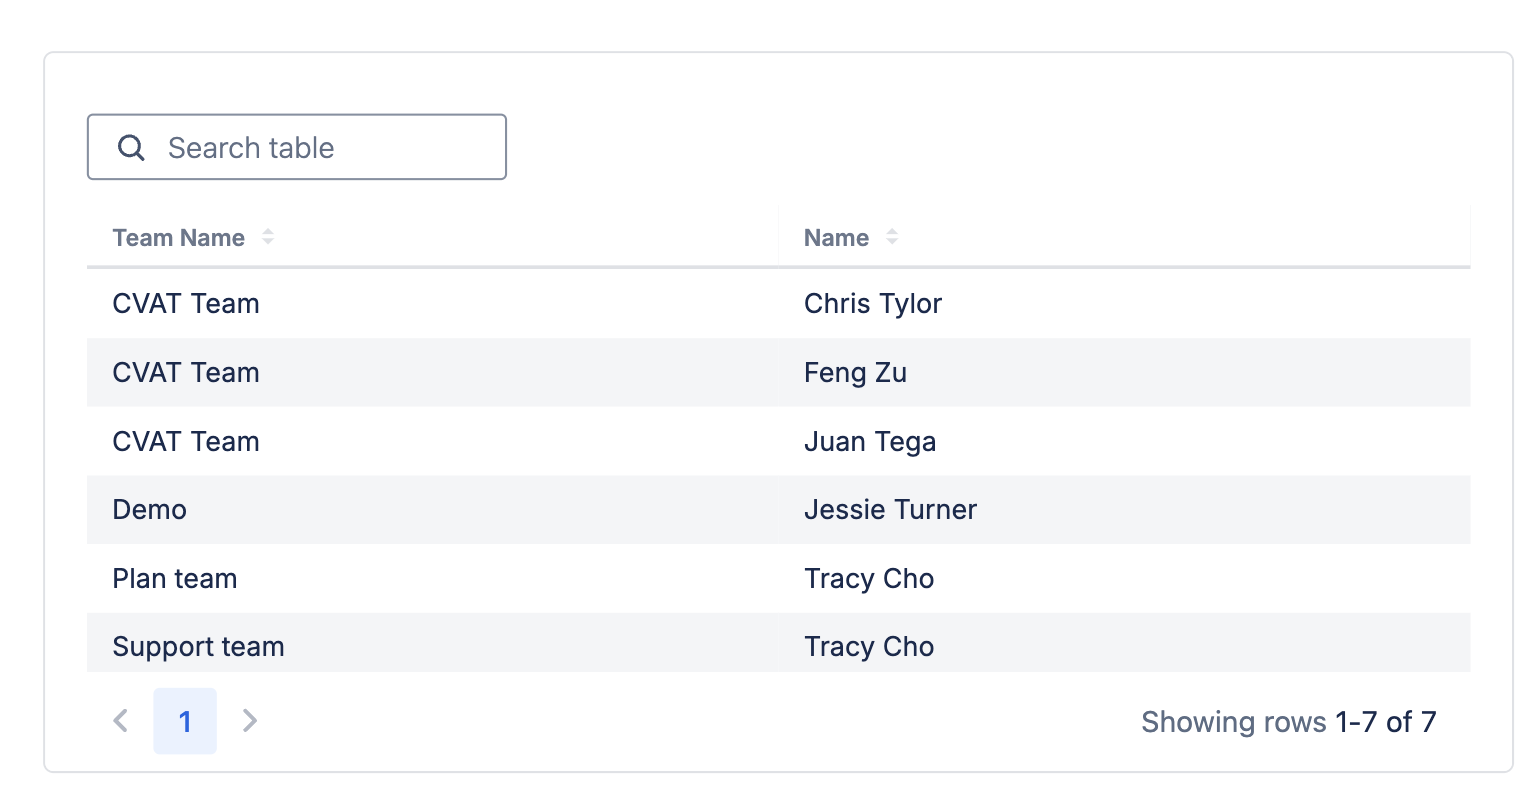
The chart will now show a list of your team names and the individuals who have been added to that team as seen below:
Query number of users per team
If you’d like to get a count of users per team, you can make a modification to the chart we just created:
Modify the Name column from the Account table to use the Count of unique aggregation
Leave the Name column from the Team table grouped
Optional: Rename the “Count of unique Name” column to “Users” or “Team members” to help with clarity
Run the query
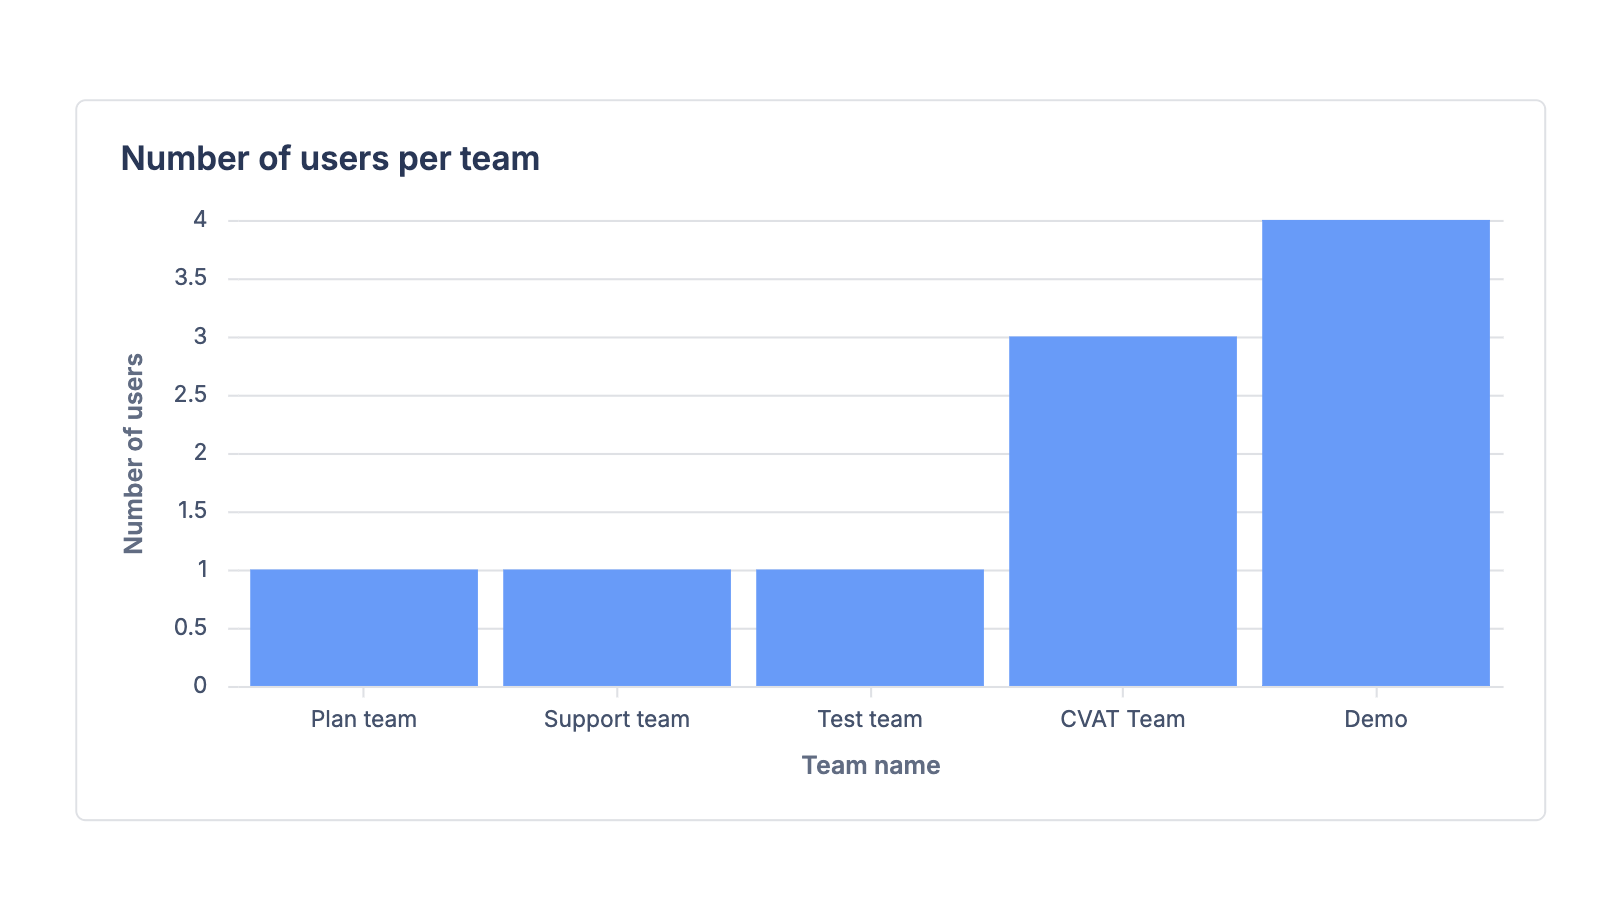
This will return a bar chart, as seen below:
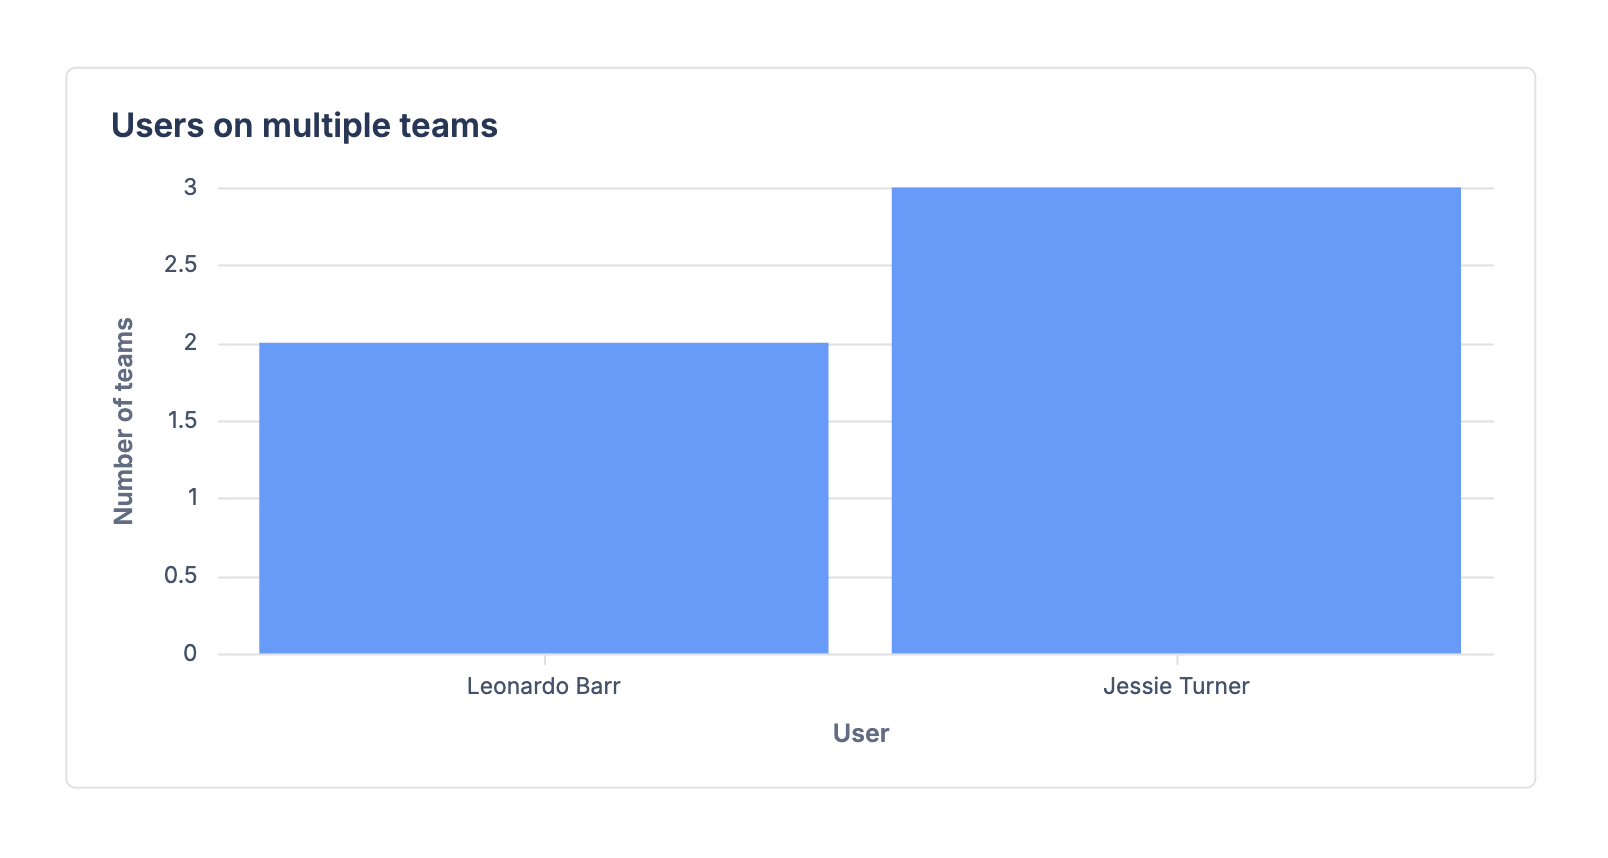
Query number of teams a single user belongs to
If you’d prefer to see how many users are on multiple teams, you can create the initial chart before applying the steps below:
Modify the Name column from the Team table to use the Count of unique aggregation
Leave the Name column from the Account table grouped.
Optional: Rename the “Count of unique Name” column to “Teams” for clarity
Run the query
Add a Filter step to include any rows where the “Teams” column is greater than 1
This will exclude any users who have only been added to a single team
Now that you’re familiar with the team data, you can begin to use Atlassian Analytics to learn more about how your organization uses teams.
Was this helpful?