Build a dynamic bar chart to compare time periods
Platform Notice: Cloud Only - This article only applies to Atlassian apps on the cloud platform.
It can be helpful to create a chart that monitors a metric’s growth in comparison to something else. Rather than using static date values, you can leverage Atlassian Analytics’s relative date variables to create dynamic charts whose date ranges update automatically. This is an example of a bar chart that compares Jira issues created in the current month with the previous month:
First, open the chart editor to create a new chart. To do this, you can either:
Select Create > Chart from the global navigation
Select Add chart from a dashboard’s sidebar
Select your data source at the top-left corner of the query. In this example, we use our Atlassian Data Lake connection.
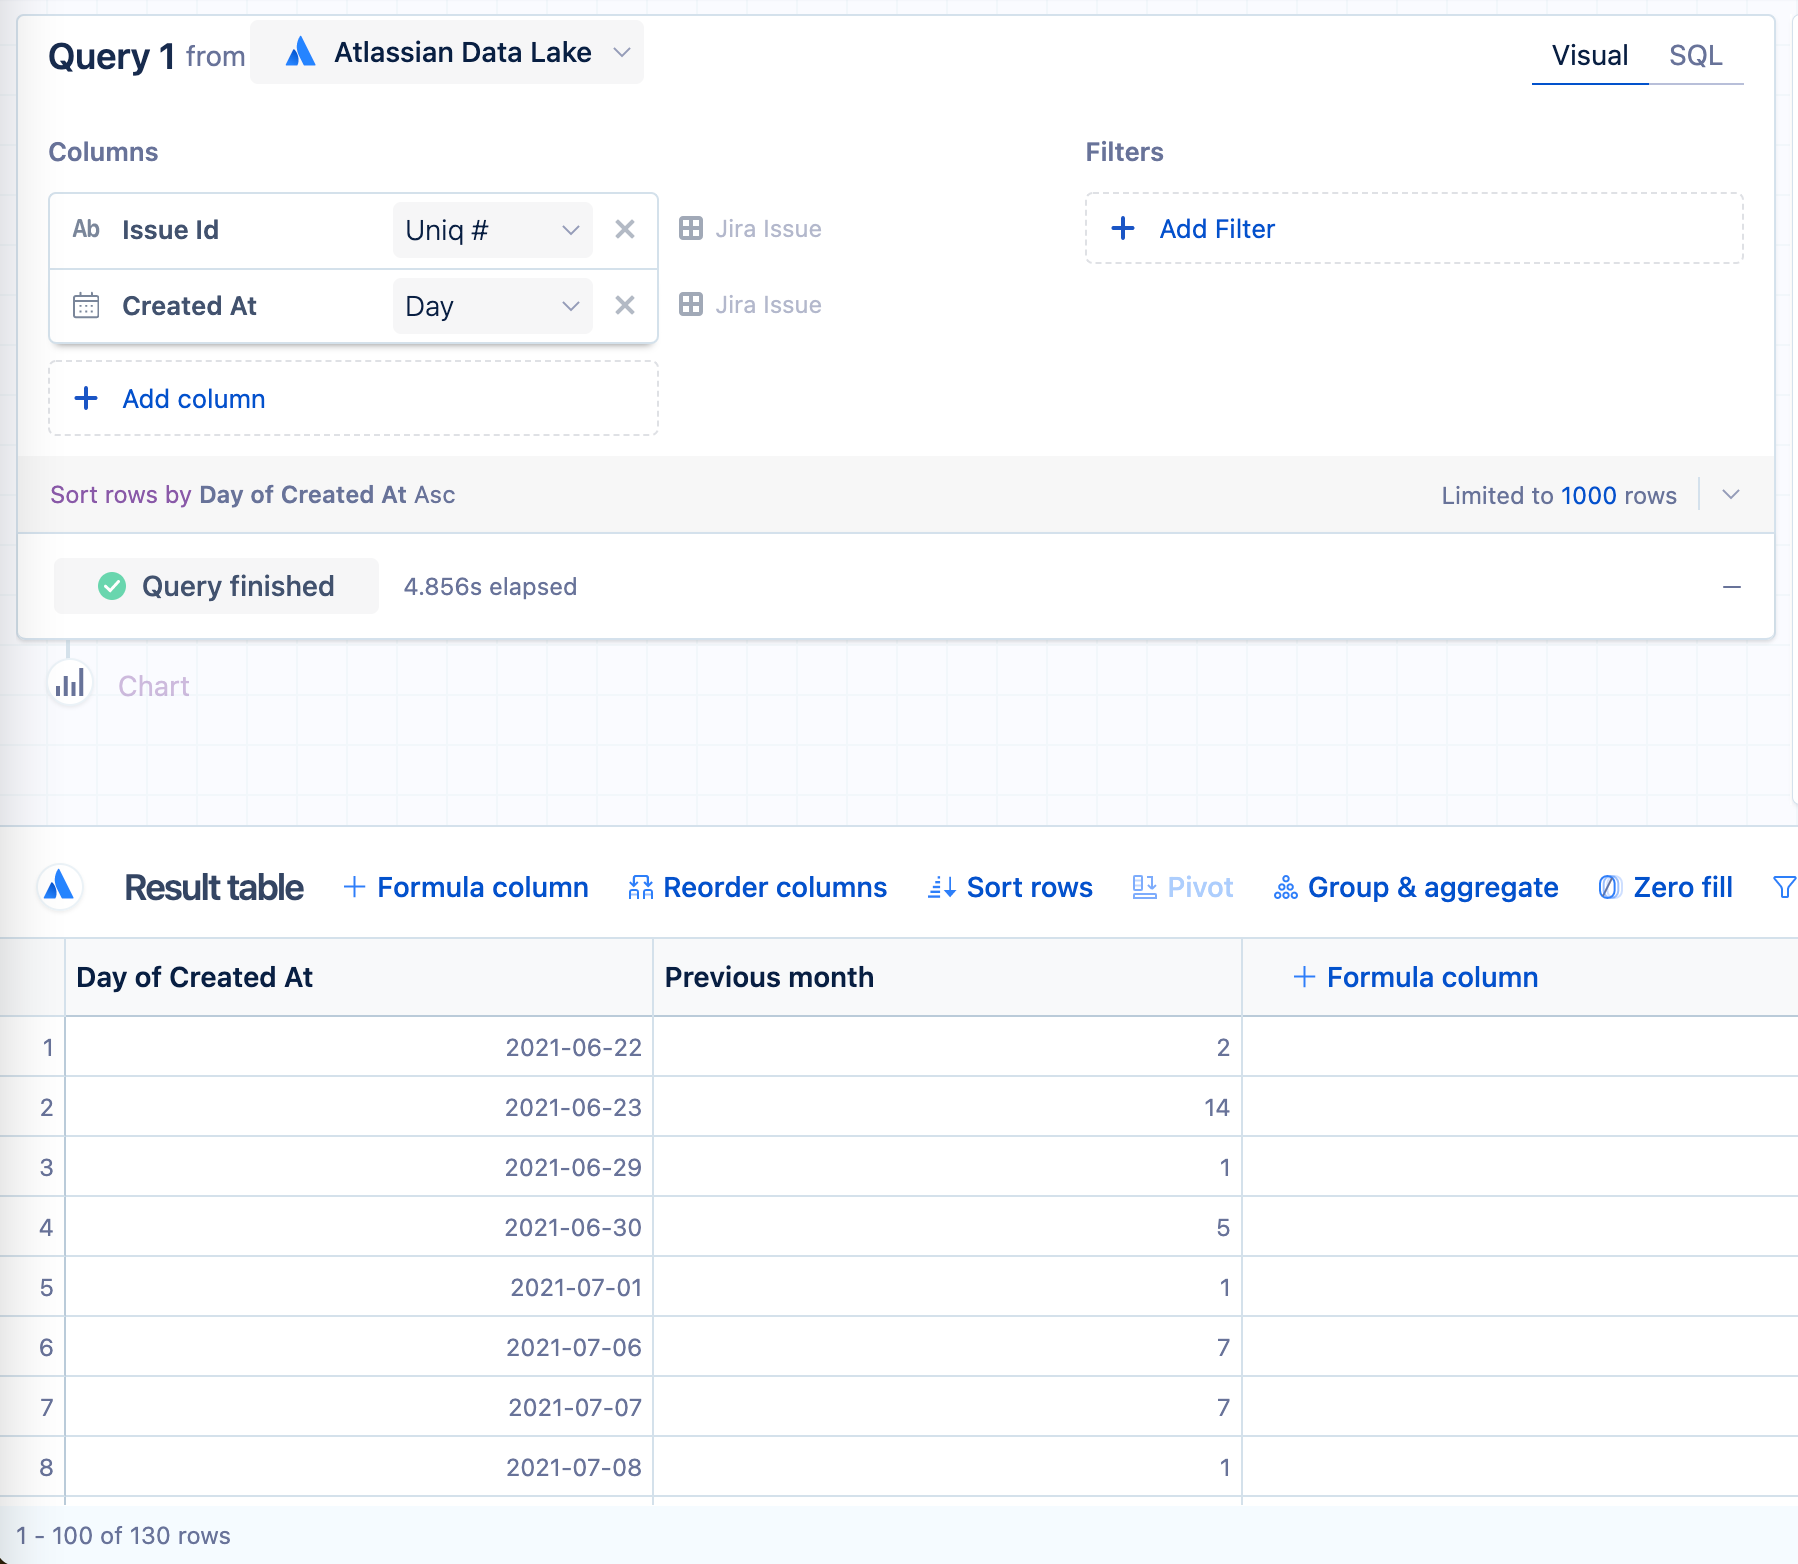
From the Jira Issue table, add the Issue Id and Created At columns to the columns section of the query.
Leave the aggregation as Count of distinct for “Issue Id” and the time bucket as Day for “Created At”
Select "Count of distinct Jira Issue Id" in the result table to rename the column; change the name to "Previous Month" for clarity.
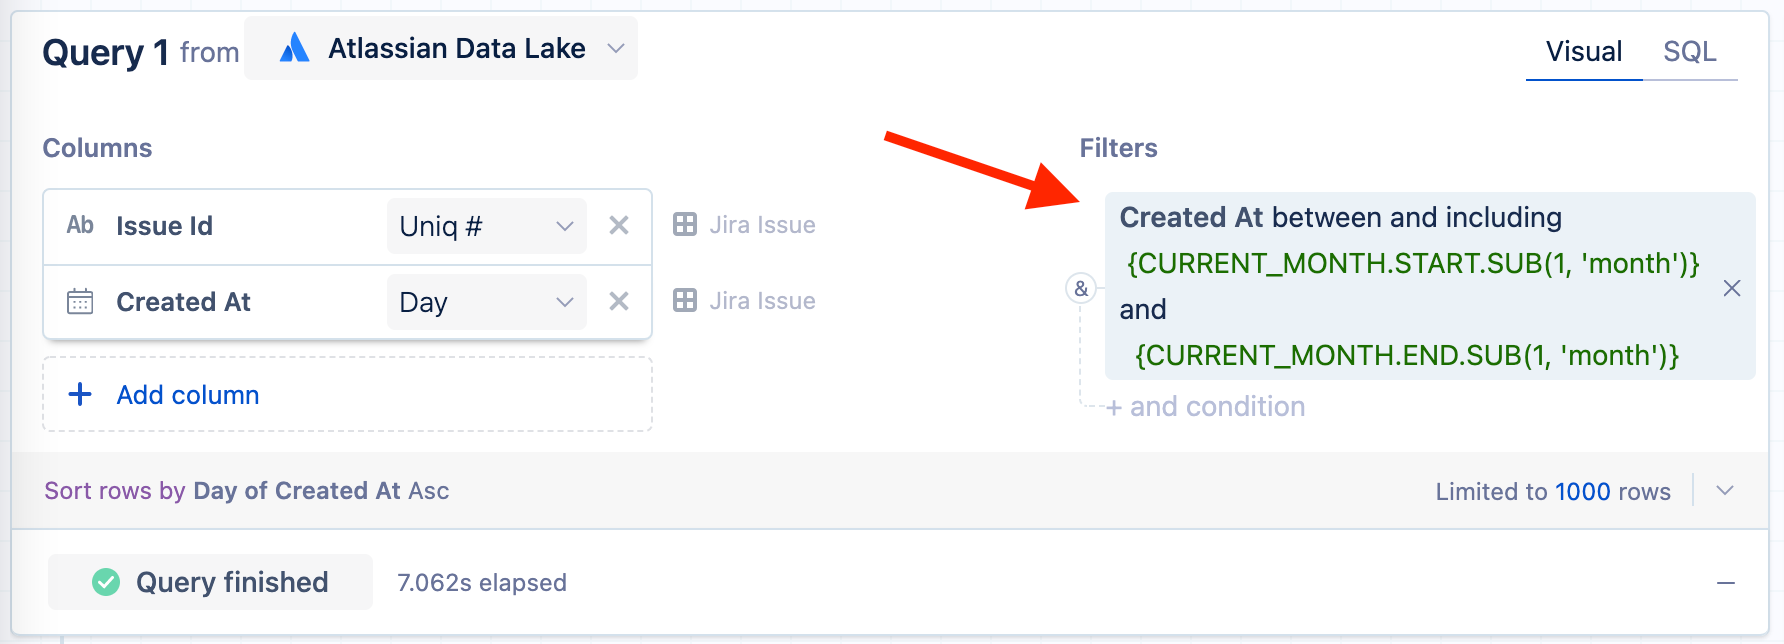
Now also add the Created At column to the “Filters” section of the query. We want to make sure to use the same date column for bucketing and filtering our metric.
For the filter operator, use between and including
For the starting date of your filter range, use
{CURRENT_MONTH.START.SUB(1, 'month')}.This relative date variable sets the current date of the filter to the first day of the previous month. To explain the code a bit more, it starts with the current month, goes to the first day of the current month, then subtracts one month—giving the first day of the previous month!
For the ending date of your filter range, use
{CURRENT_MONTH.END.SUB(1, 'month')}.This is similar to how we got the starting date, but instead looks at the last day of the month.
Select Run query.
You can transform the output data of your query by adding more Visual SQL steps after the query. For example, you can add a “Zero fill” step. In our example, this shouldn’t change anything, but it’s good to have this step in case you have any gaps in your data.
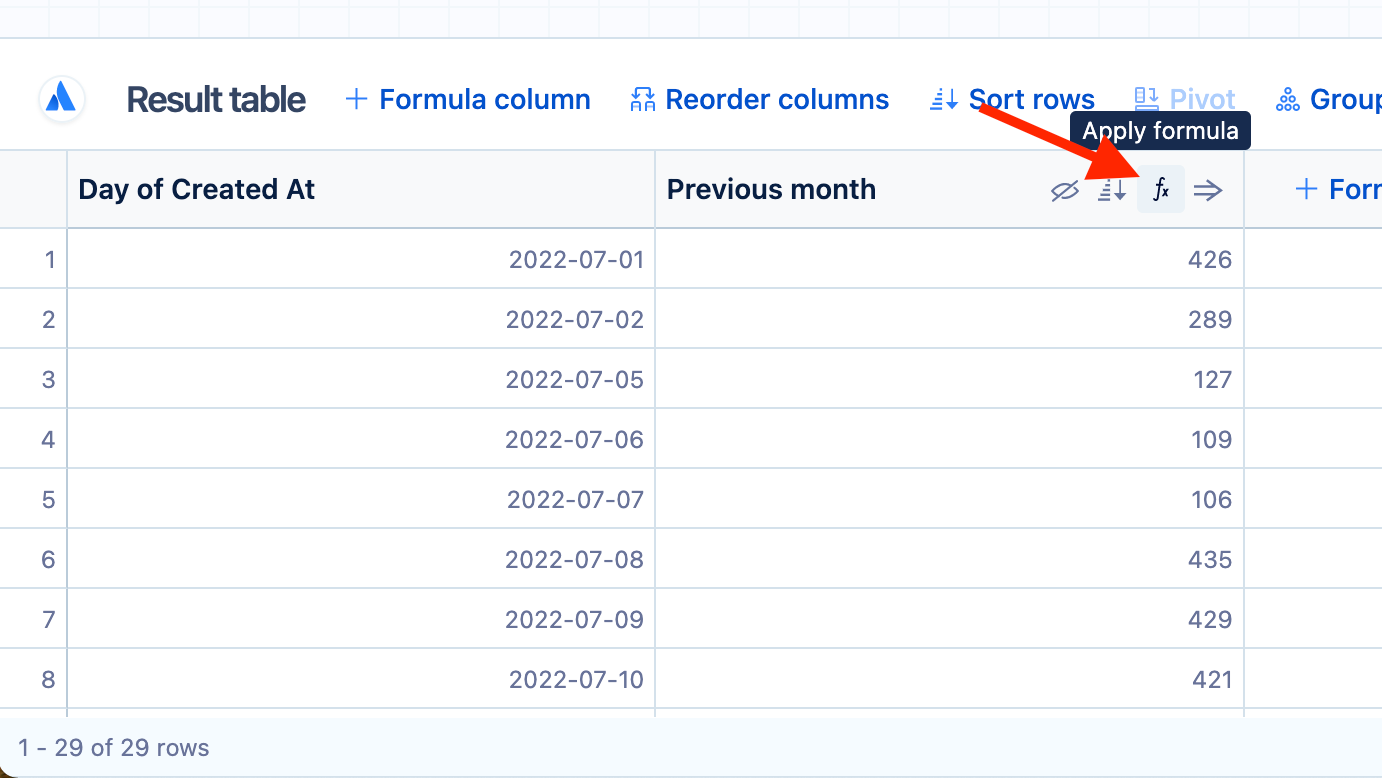
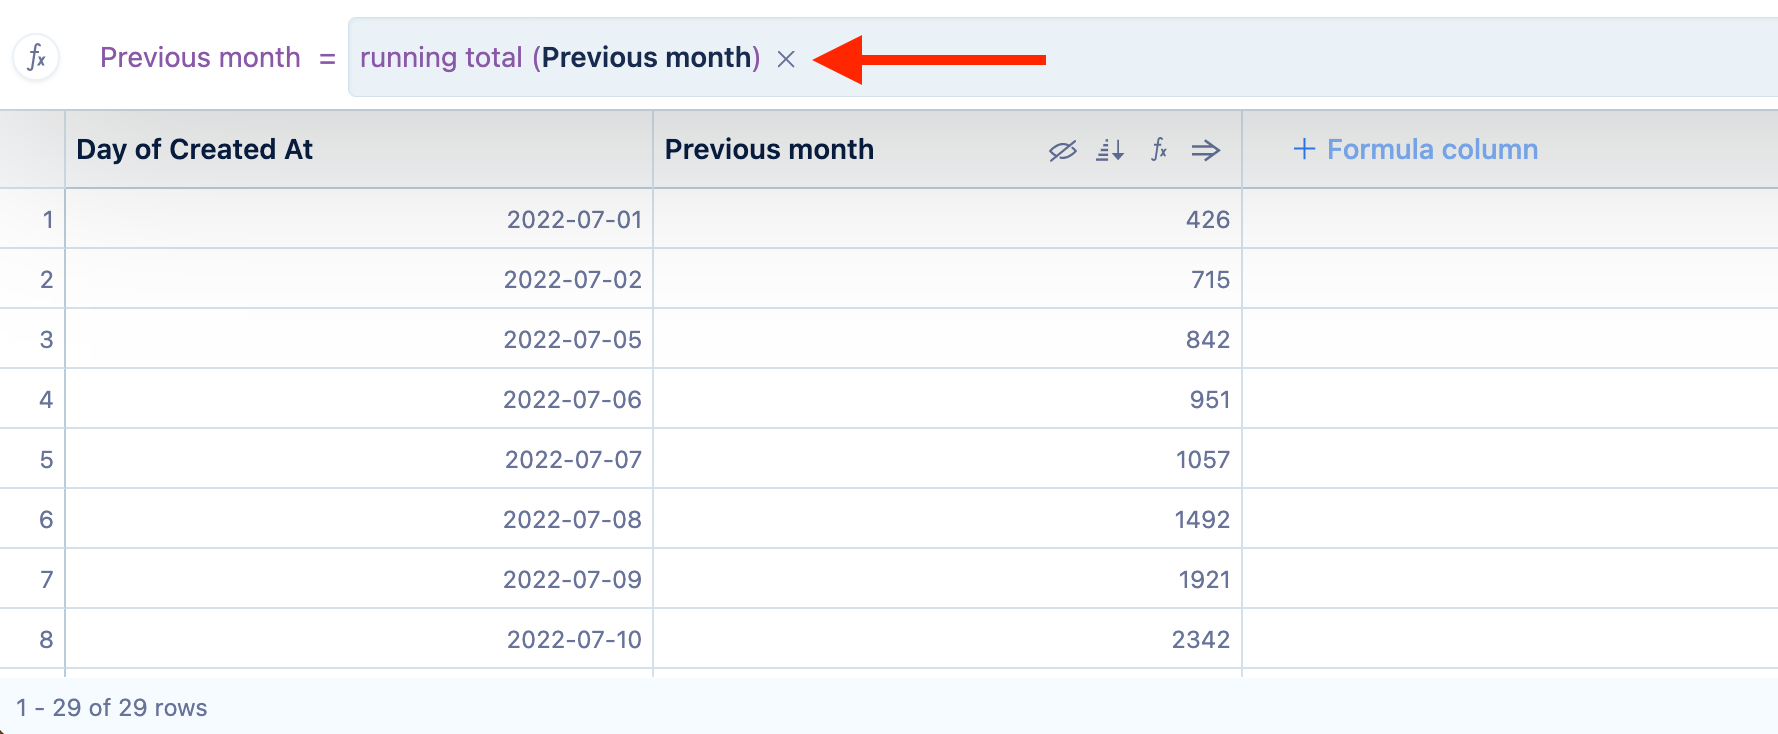
Use an “Apply formula” step to get a running total for the "Previous month" column. Select Save to save your changes. Your “Previous month” column now reflects the previous month’s running total.
In order to compare the count on the first day of the previous month to the first day of the current month, we need to add another column. Add a “+ Formula column” step, select Custom as the formula type, then use the following formula to calculate the difference between the first day of the previous month and whatever date is in each row of the “Day of Created At” column:
DATEDIFF({CURRENT_MONTH.START.SUB(1,'month')}, "Day of Created At")For clarity, let’s also rename this column to "Day #".
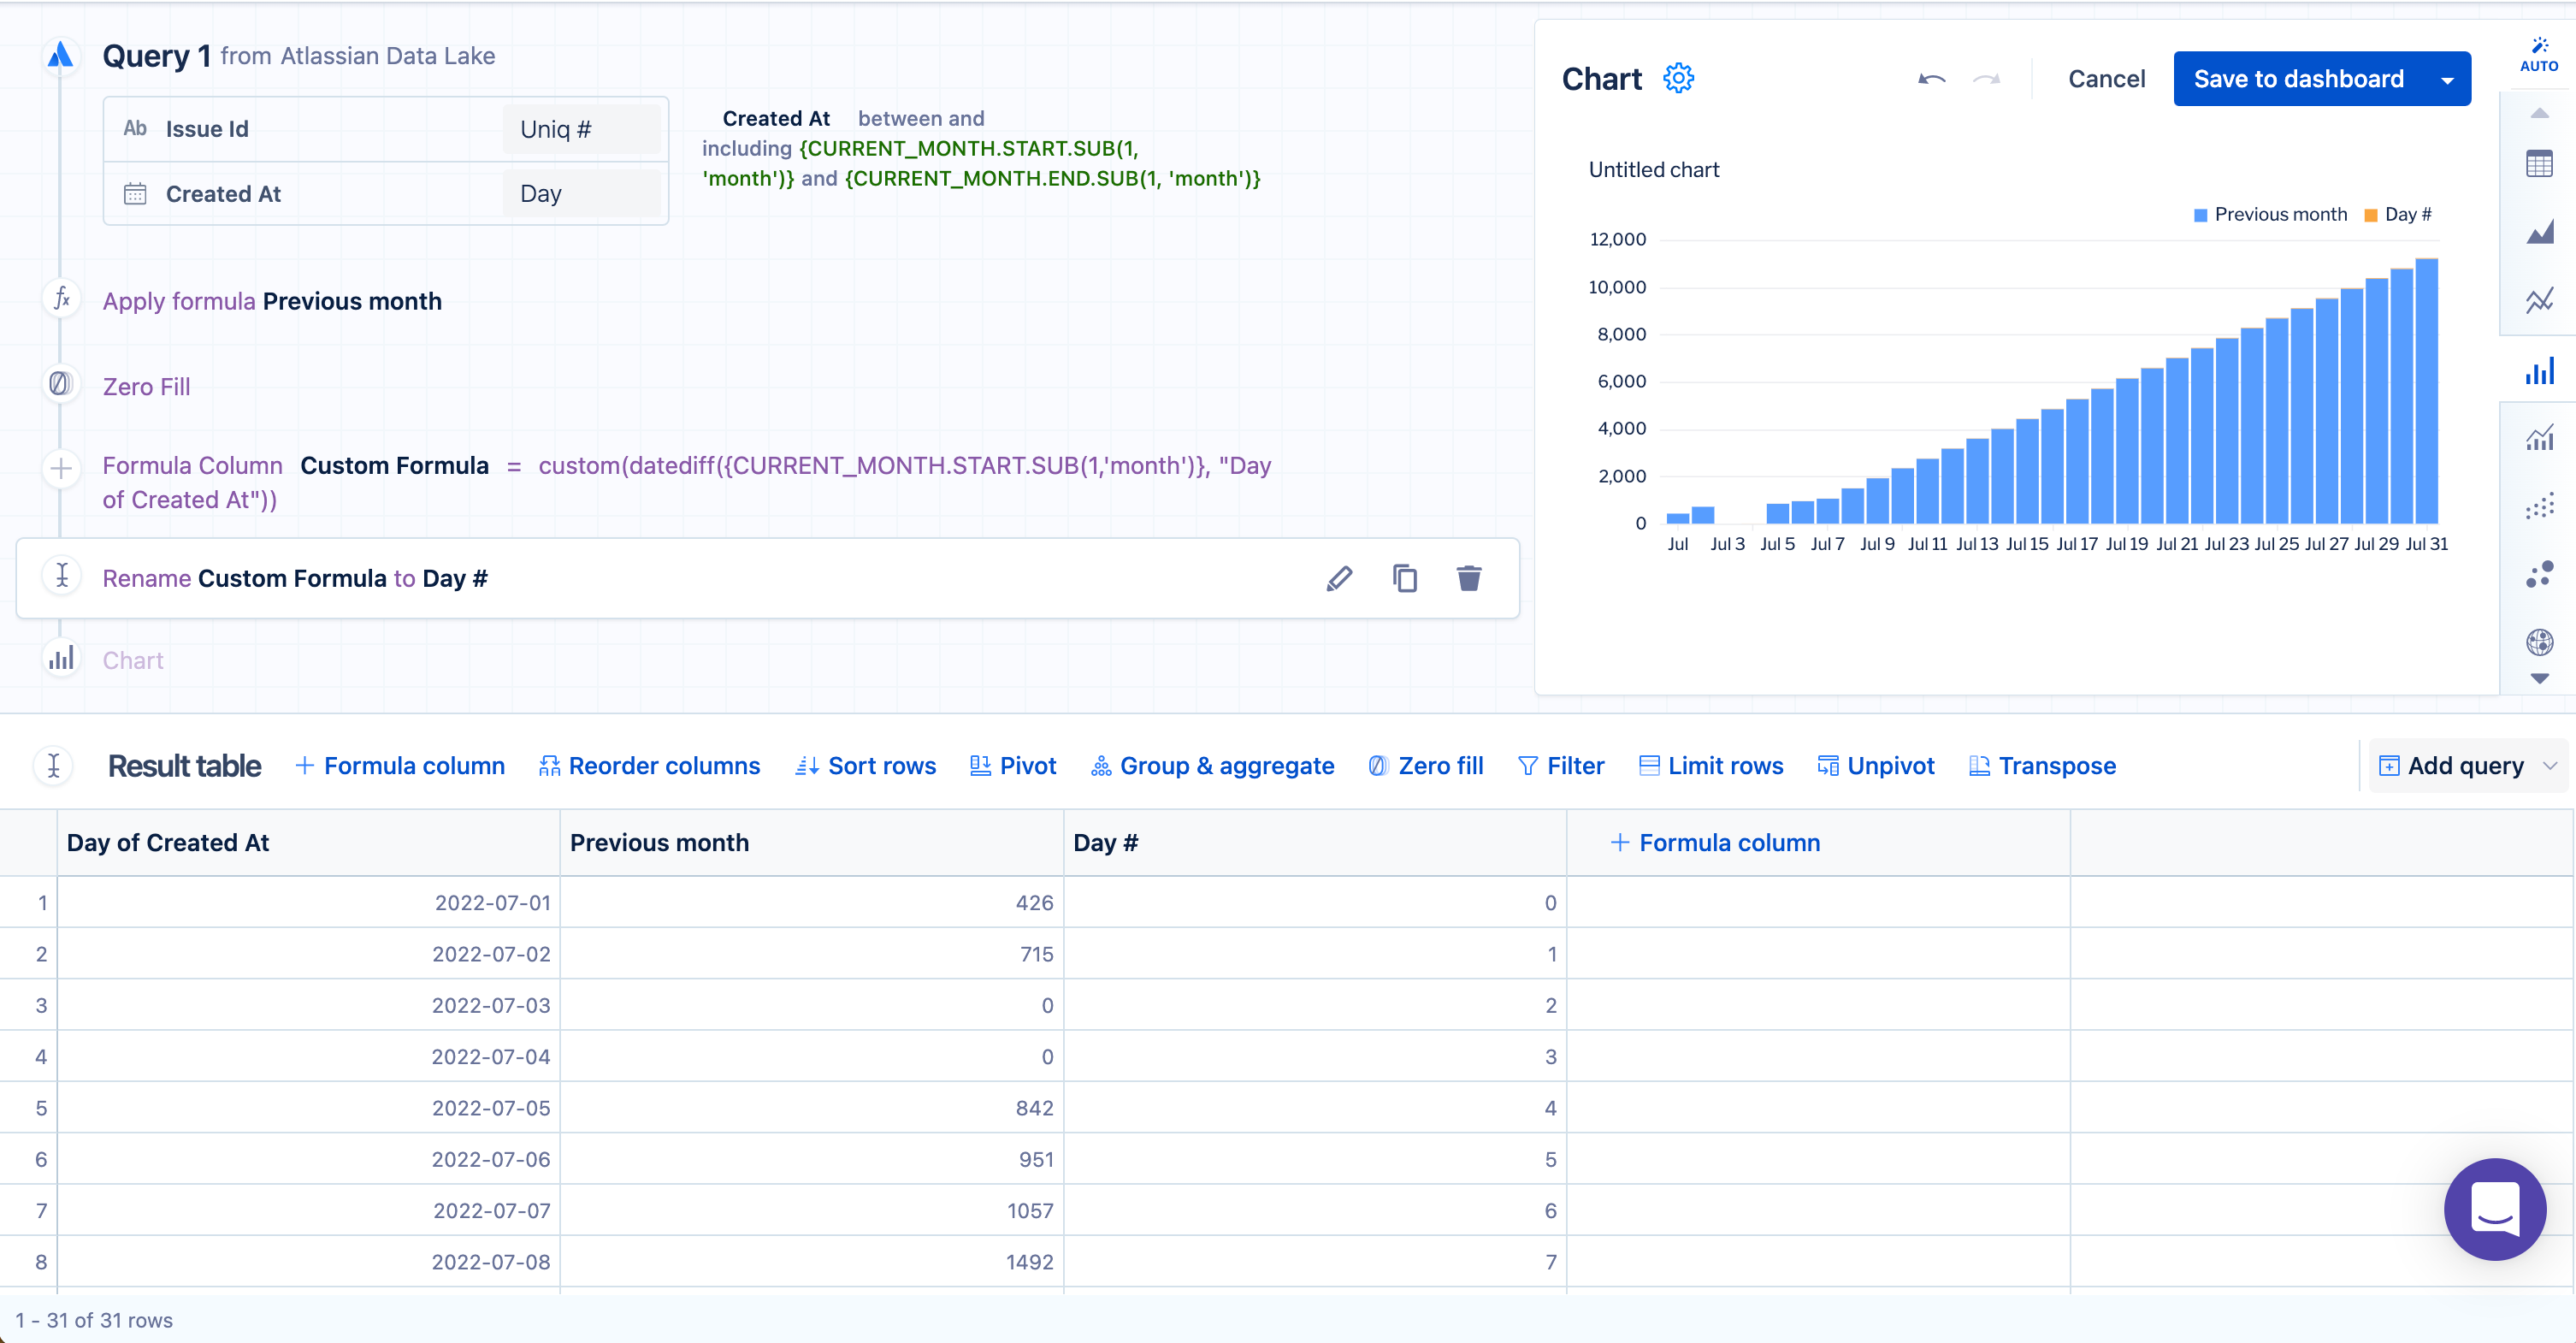
Hide the "Day of Created At" column. Since we’ll compare using the “Day #” column, we don’t need the “Day of Created At” column anymore.
You can combine Steps 6 and 7 by instead using an “Apply formula” step on the “Day of Created At” column and use the same custom formula provided in Step 6. Then just rename “Day of Created At” to “Day #”.
Use the “Reorder columns” step to move Day #so it’s the leftmost column in the result table.
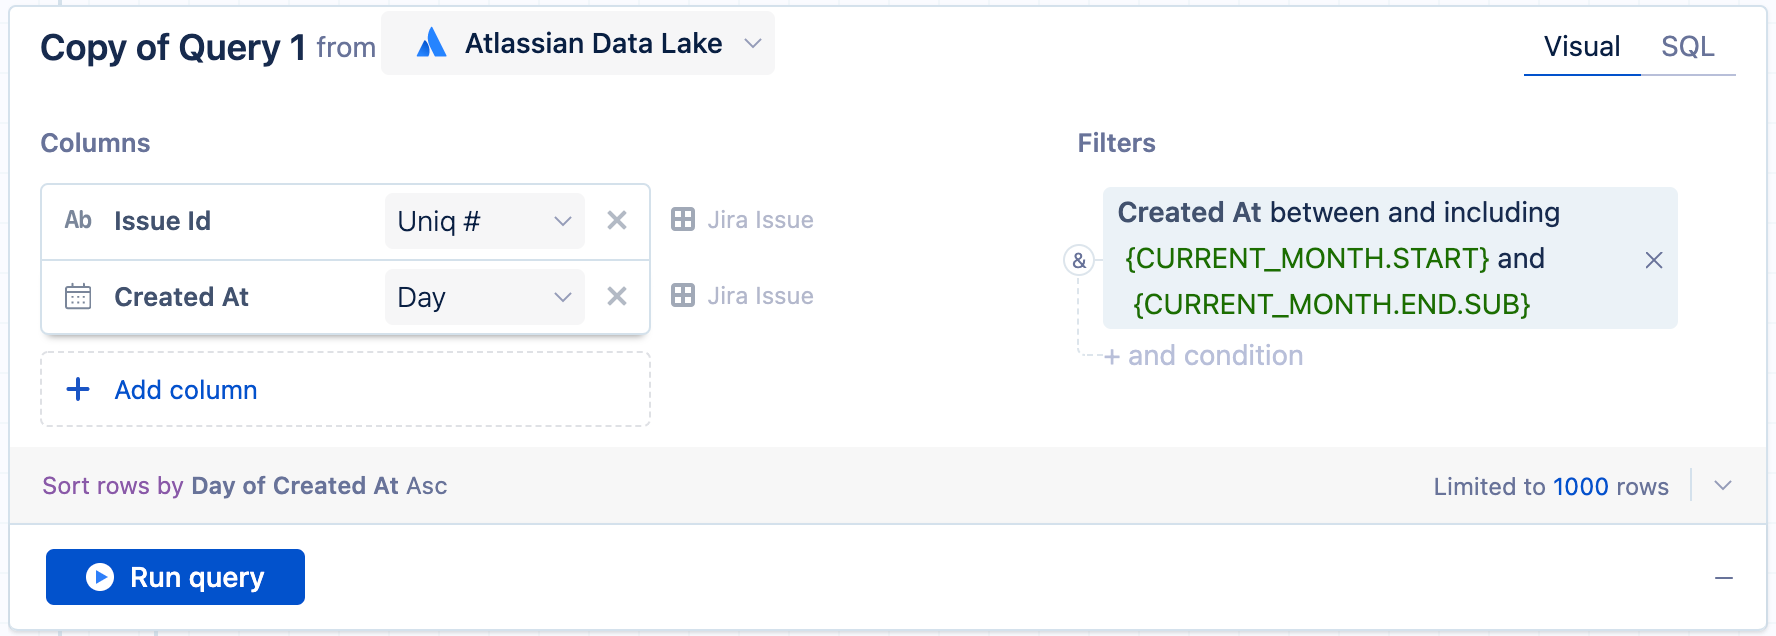
Now you need to bring in data for the current month. Select Add query > Copy of Query 1 to quickly make a clone of the first query. You need to apply the same transformations (Steps 2 - 8) to the second query (with a few adjustments) to properly merge the two queries, which we can do before we merge them:
For “Copy of Query 1”, edit the starting and ending dates for the “Created At” filter to
{CURRENT_MONTH.START}and {CURRENT_MONTH.END}, respectively.Select Run query.
Select "Previous Month" in the result table to rename the column; change the name to "Current month" for clarity.
Select Run query again.
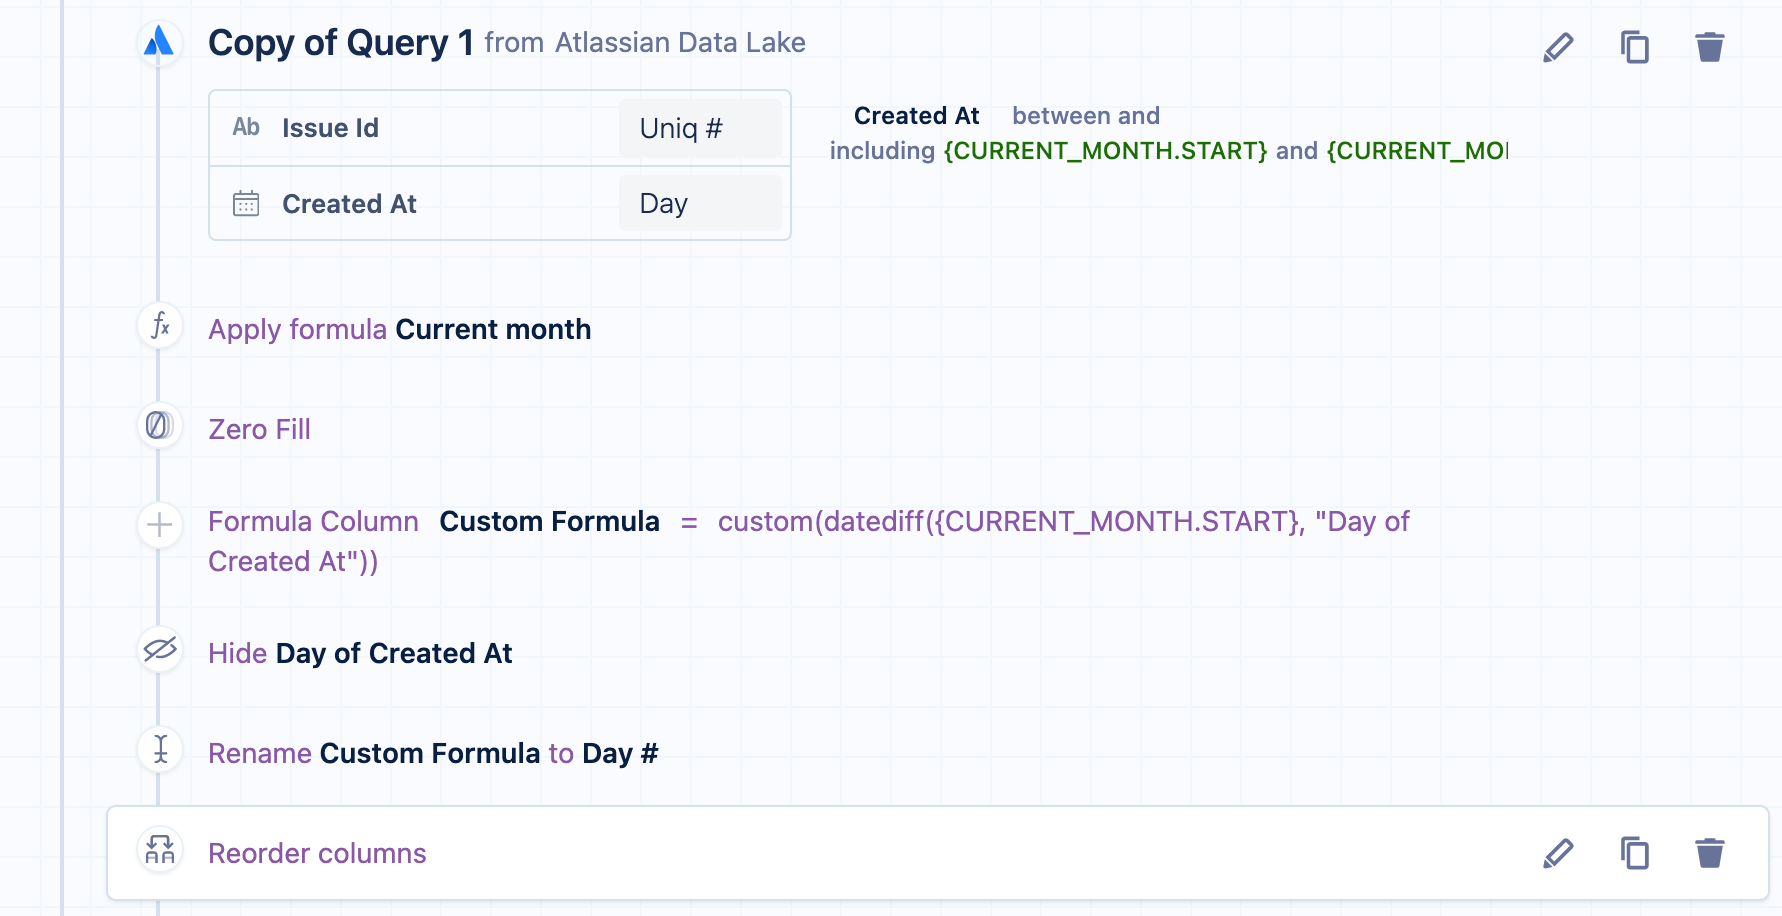
Use an “Apply formula” step to get the running total for the “Current month” column.
Add a “+ Formula column” step, select Custom as the formula type, then use the following formula:
DATEDIFF({CURRENT_MONTH.START}, "Day of Created At")Rename this new column to "Day #".
Hide the "Day of Created At" column.
Move the "Day #" column so that it’s the leftmost column in the result table.
Select the “Join” step that was added after you created the second query to view the post-merge result set. By default, the two result sets are merged with an outer join, which is what we want for this example.
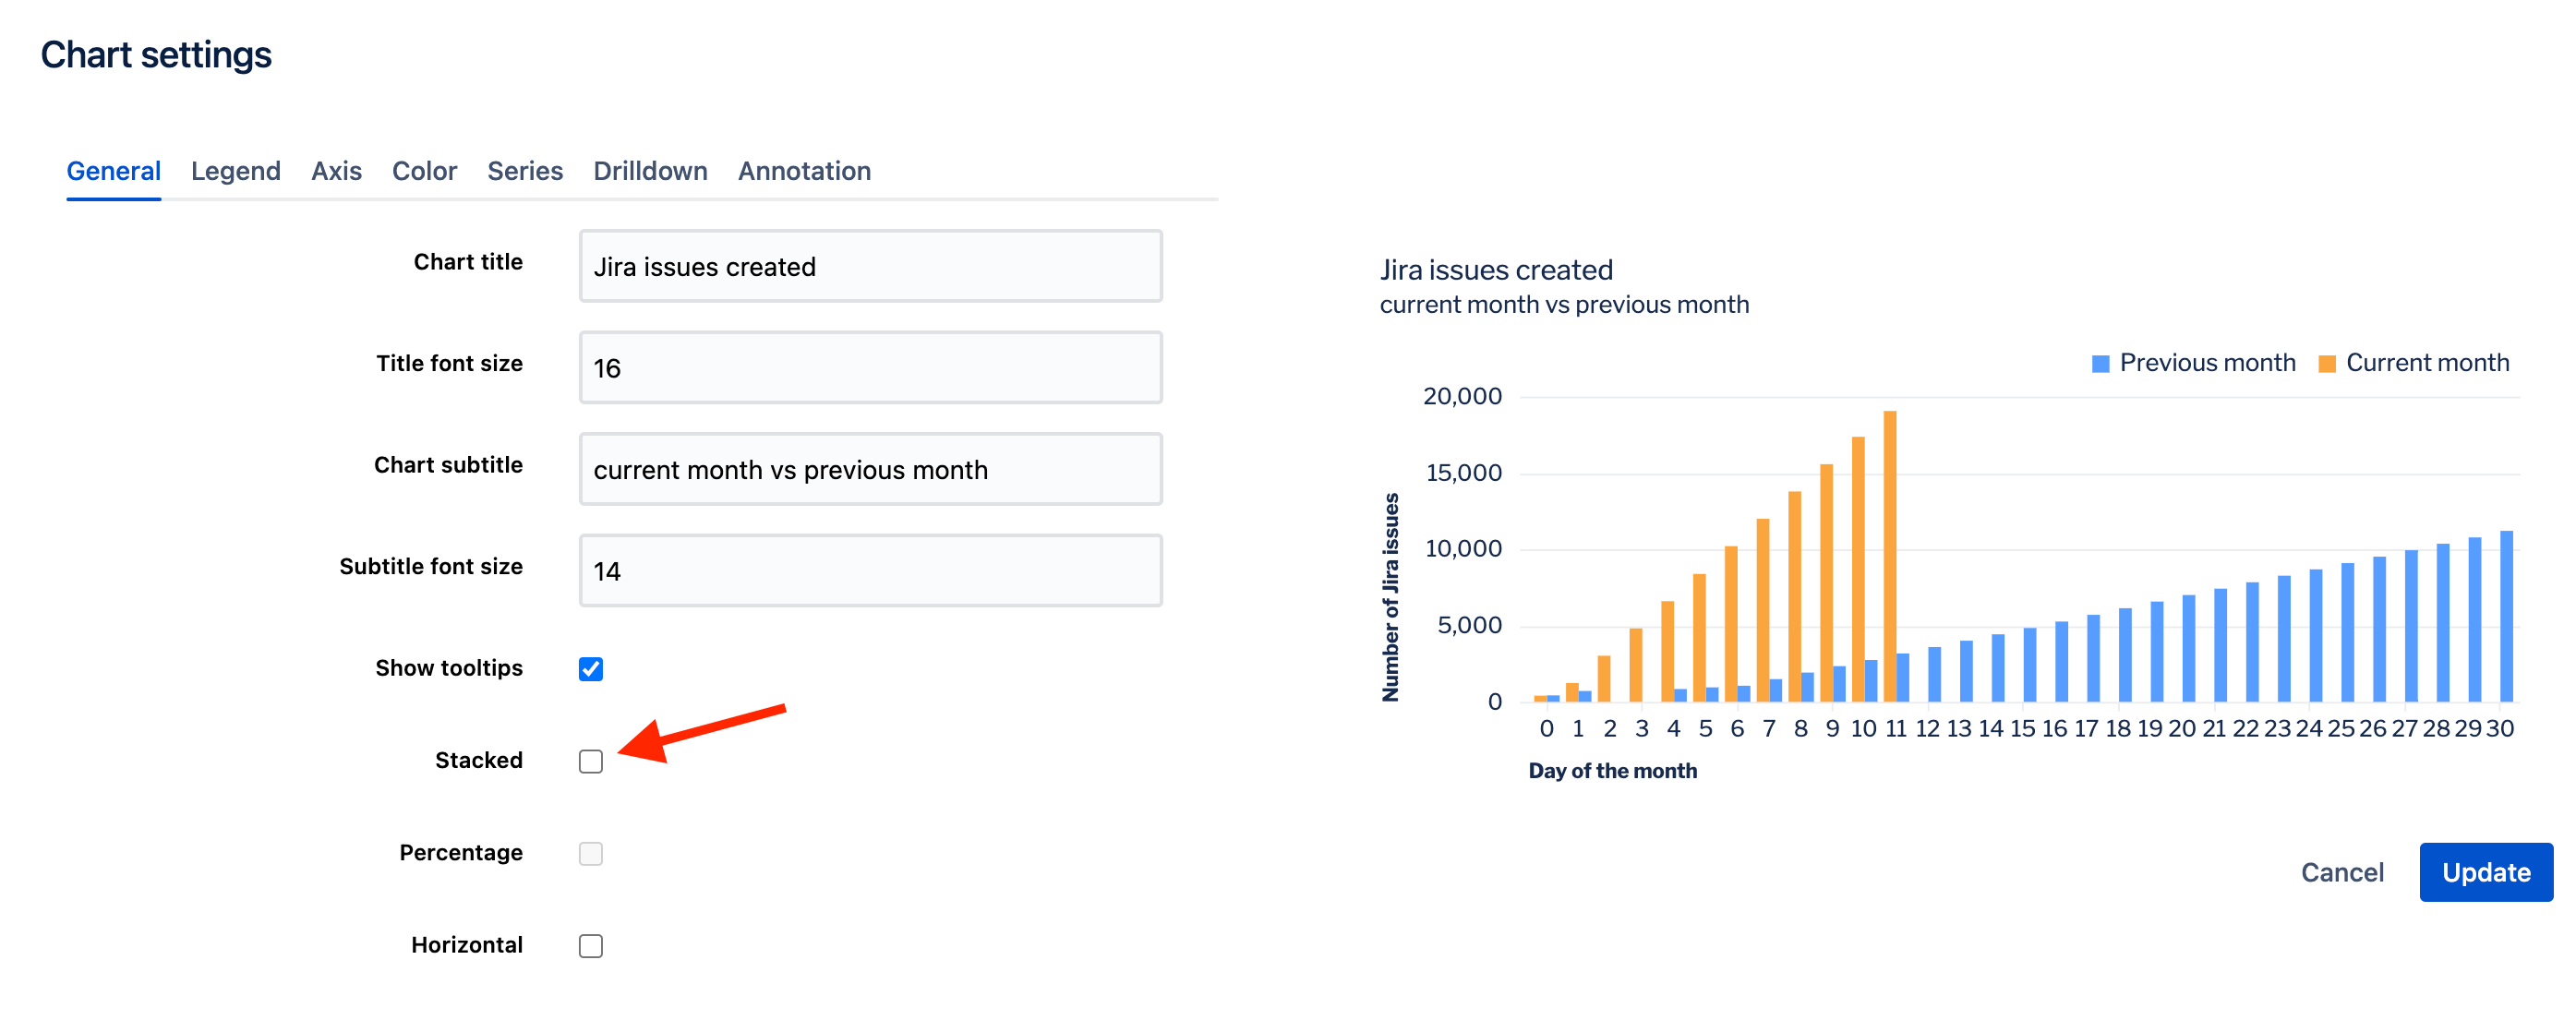
Select Bar as the chart type and update the bar chart settings by selecting the gear icon above the chart preview. In the General tab of the chart settings, deselect "Stacked" to have separate bars for the previous and current month’s data. Feel free to change the other settings too!
Was this helpful?