Querying Assets objects in a custom field
Platform Notice: Cloud and Data Center - This article applies equally to both cloud and data center platforms.
Support for Server* products ended on February 15th 2024. If you are running a Server product, you can visit the Atlassian Server end of support announcement to review your migration options.
*Except Fisheye and Crucible
Summary
If you use asset and configuration management and have added your objects to issues via Jira custom fields, then this article can help you query that data.
Solution
Before we begin, you might want to read through our articles on querying custom fields and other Assets example queries to help you become familiar with some of the tables that the queries will use.
The Assets custom field can be configured to allow a single object or multiple objects to be selected at once. Regardless if the field can select one object or multiple objects, the object ID of the object(s) will be stored in array formatting. If a single object is selected on the custom field the values will be formatted like [{object ID}], while multiple objects selected in the custom field the values will be formatted like [{object 1’s ID}, {object 2’s ID}, {object 3’s ID}] and so on until all of the selected object IDs are listed in the array.
For this example, we’ll be querying issues that have an object selected in the Assets object custom field named “Office”.
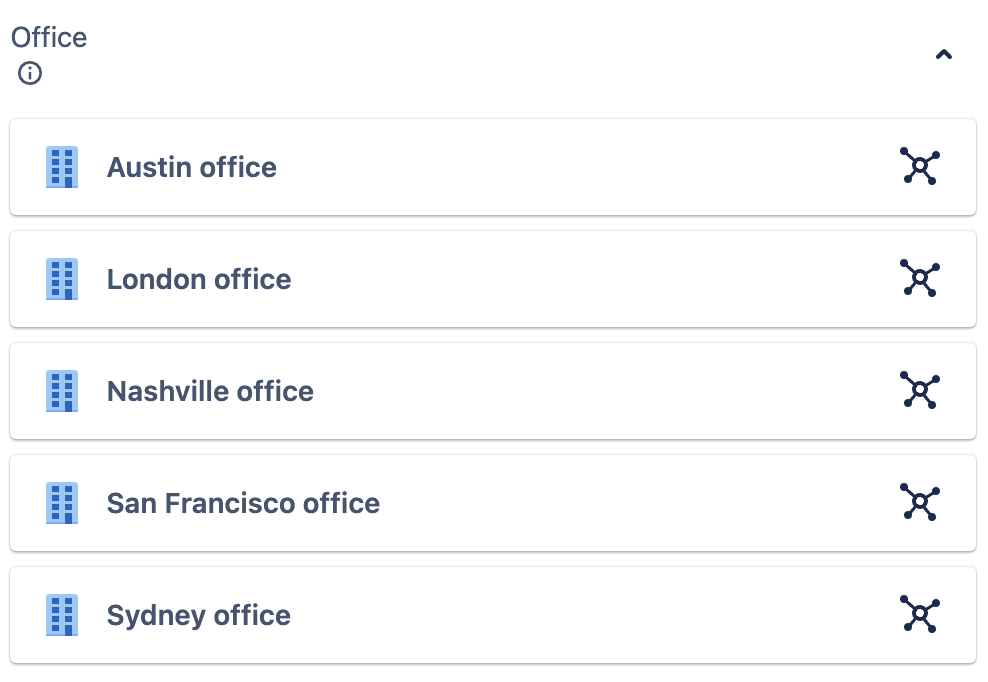
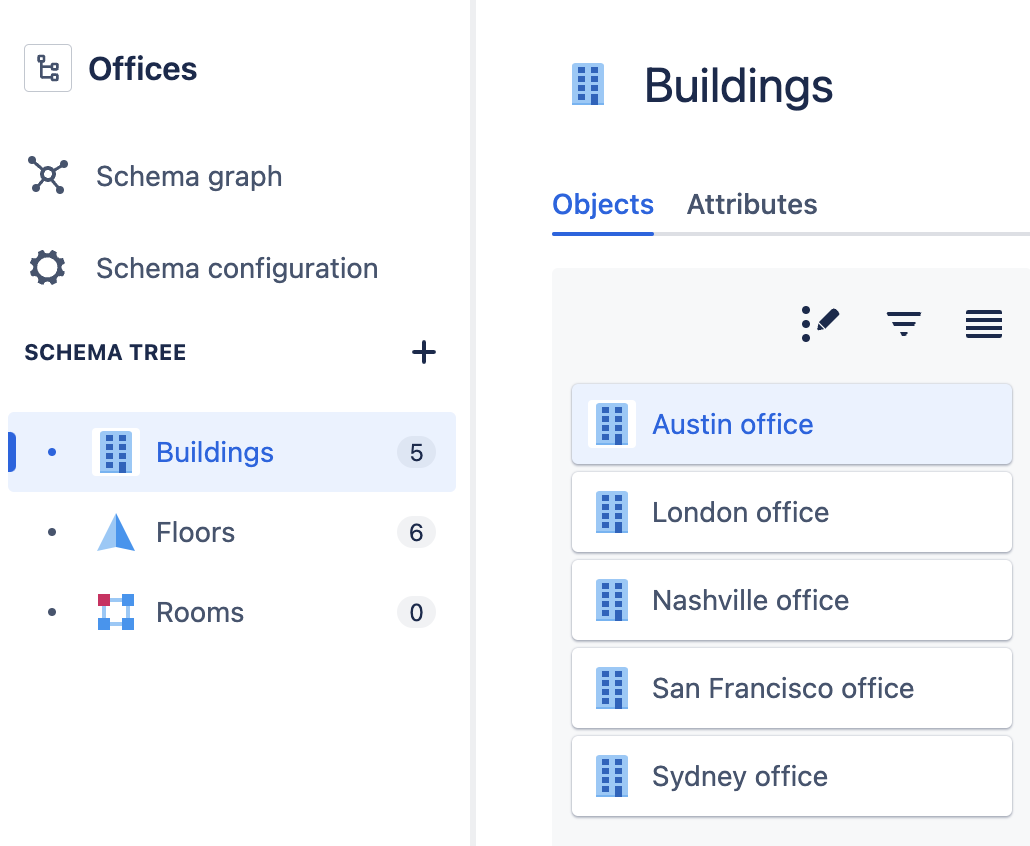
The objects that can be selected within the “Office” custom field are objects of the Buildings object type.
Select Create > Chart > Custom chart from the global navigation to start with a blank visual mode query.
Add the following columns to your query:
The Label column from the Assets object table and use the Group aggregation.
The Issue ID column from the Assets object issue mapping table and use the Count of unique aggregation.
Add a filter where the Name column from the Assets type table equals the object type of the asset object that can be selected in your custom field.
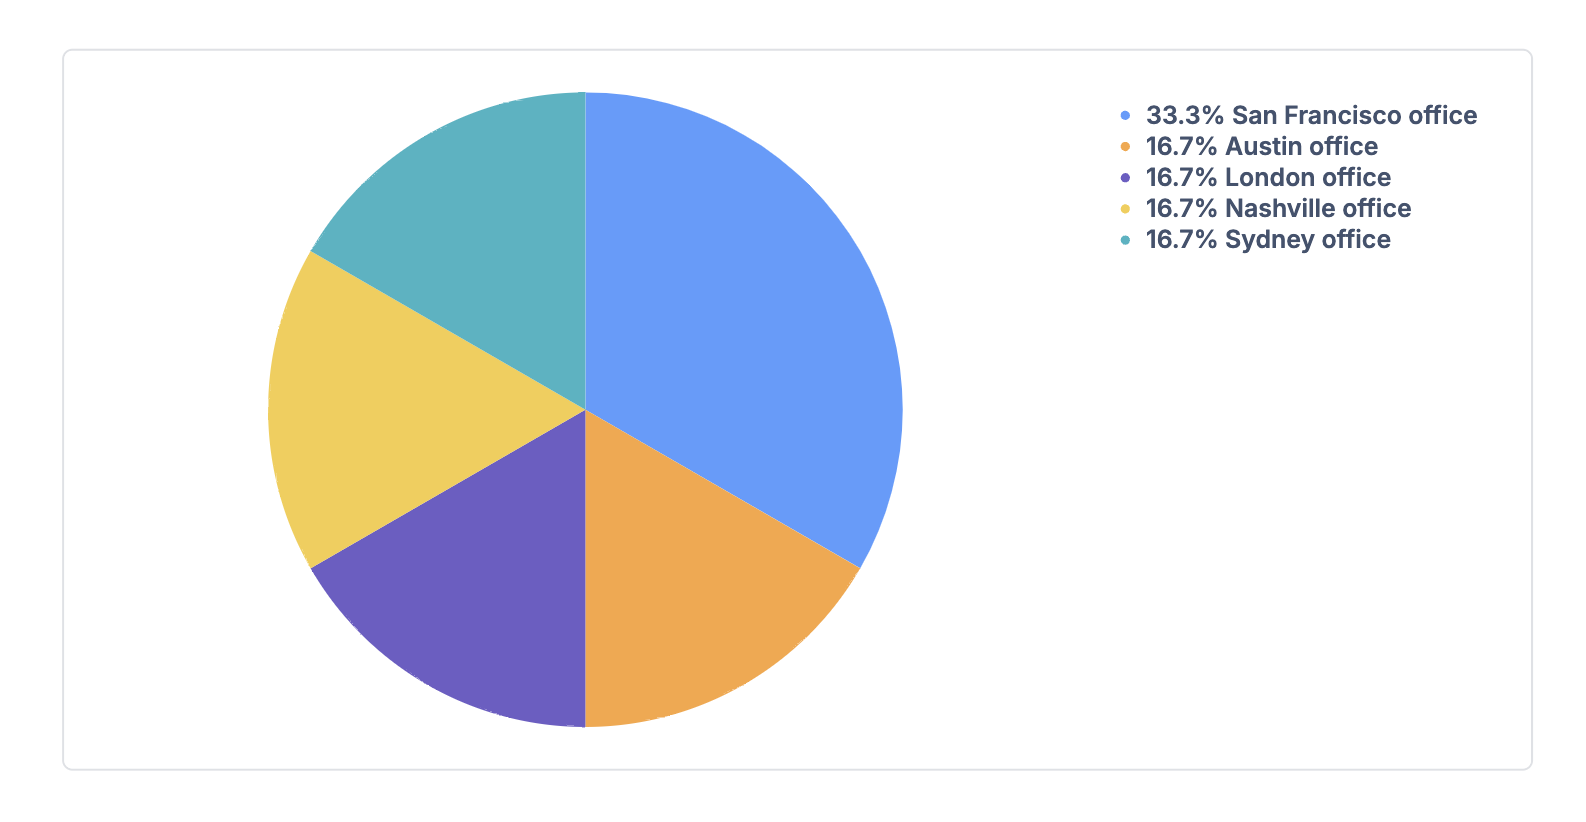
Select Run query.
You now have a chart visualizing the number of issues assigned to each object that can be selected within your Assets object custom field.
Displaying the values of an Assets object custom field
Continuing from the above example, we’ll adjust our chart to be a Table chart displaying the names of the objects selected per issue.
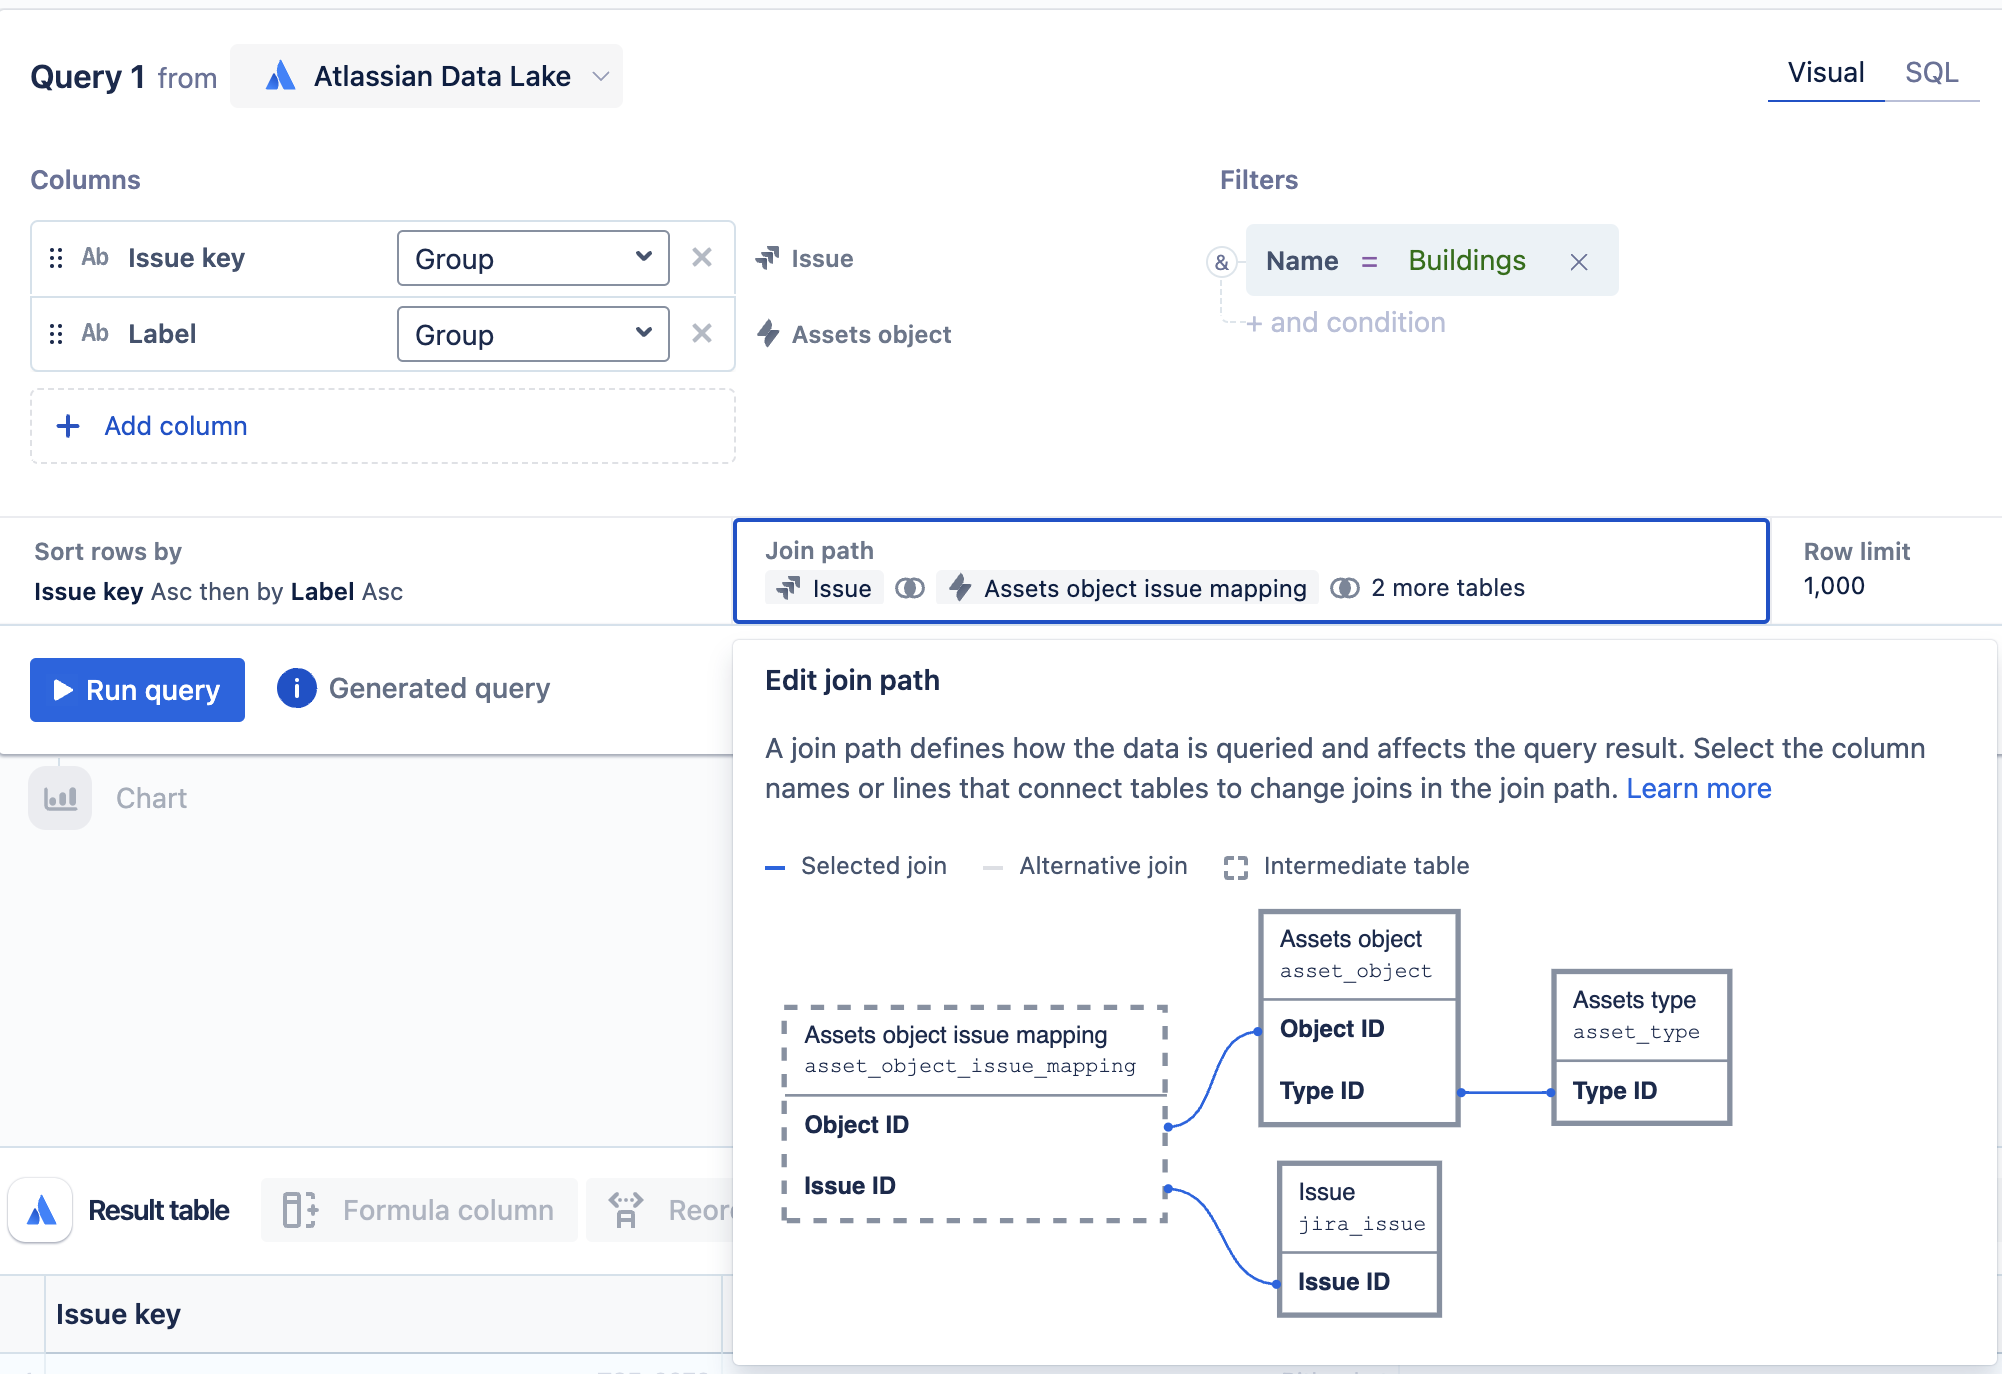
Update the columns selected in the chart to be the following:
The Label column from the Assets object table and use the Group aggregation.
The Issue key column from the Issue table under “Jira family of products” and use the Group aggregation.
Verify that the Join path used in the query connects the Issue ID column from the Issue table to the Issue ID in Assets object issue mapping, that the Object ID column connects the Assets object issue mapping table to the Object ID of the Assets object table, and that the Type ID column connects the Assets object table to the Type ID of the Assets type table.
Select Run query.
Optionally, change the chart type to be a Table chart.
The Buildings object type can reference five objects, each listed in its own row. To combine these rows you can use a “Group & aggregate” step. Change the aggregation of the “Label” column to Concatenate to combine the five objects into one row, separated by a comma.
Optionally, add an “Apply formula” step for the “GROUP_CONCAT(Label)” column, select Custom as the formula type, and then paste the following formula:
REPLACE("GROUP_CONCAT(Label)", "," , ", "). This will add a space in between each comma-separated value.Optionally, rename the “GROUP_CONCAT(Label)” column to the name of your Assets object custom field name or object type.
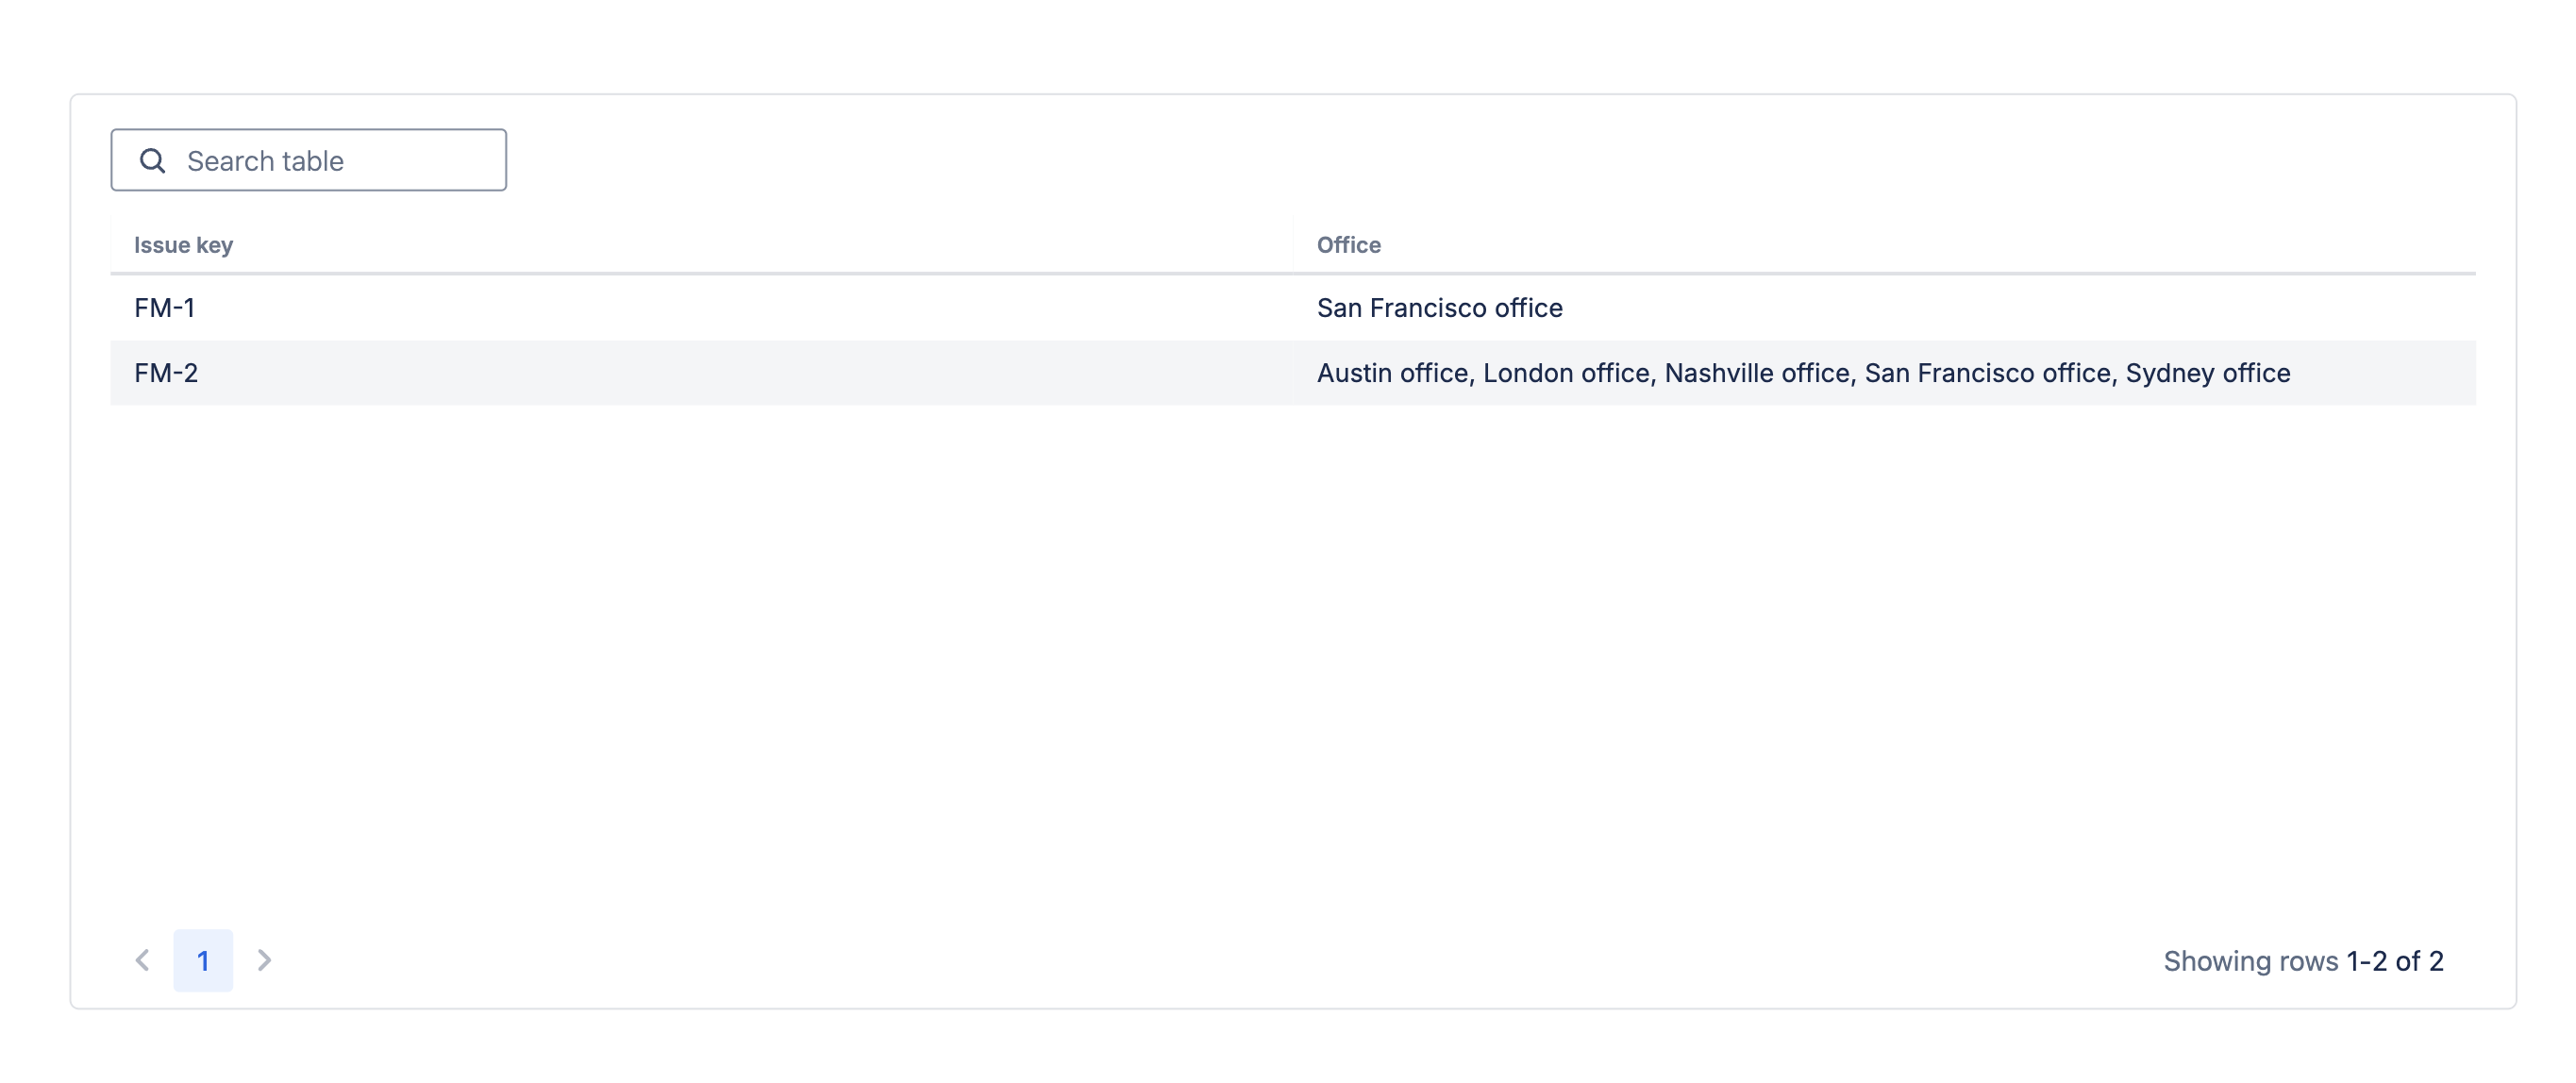
Now you have a chart displaying the objects selected within your Assets object custom field on each issue.
Was this helpful?