Display static forecast values with a bar line chart
Platform Notice: Cloud Only - This article only applies to Atlassian apps on the cloud platform.
Many times, projections are calculated as X% growth over the previous month. However, there are instances where projections calculated on your end are not true linear projections. In those cases, you may want to insert static values within your bar line chart when comparing your company’s performance to the company’s forecast.
For this example, we want to display total tickets created over time versus the projected ticket total for the current year. We’ll use an Atlassian Data Lake data source to do this.
1. The first query will contain the actual number of tickets created over time.
a. For your first Query, add the Created Date and Issue Key columns from the Jira Issue table to the columns section.
b. Change the grouping for Created Date to Month.
c. For clarity, rename the Issue Key column to “Ticket count”.
d. Add Created Date to the Filters section, choose between and including for the filter operator, and use 2021-08-01 and 2022-09-01 as the start and end dates, respectively.
e. Click Run Query.

2. Add another query—this will contain the projected number of tickets for the current year. Switch to SQL mode and use the following query to create a new time series column that starts in August 2021 and goes through September 2022:
WITH dates AS (SELECT SEQUENCE(TO_DATE('2021-08'), TO_DATE('2022-09'), INTERVAL 1 month) AS months)

SELECT EXPLODE(months) AS months FROM dates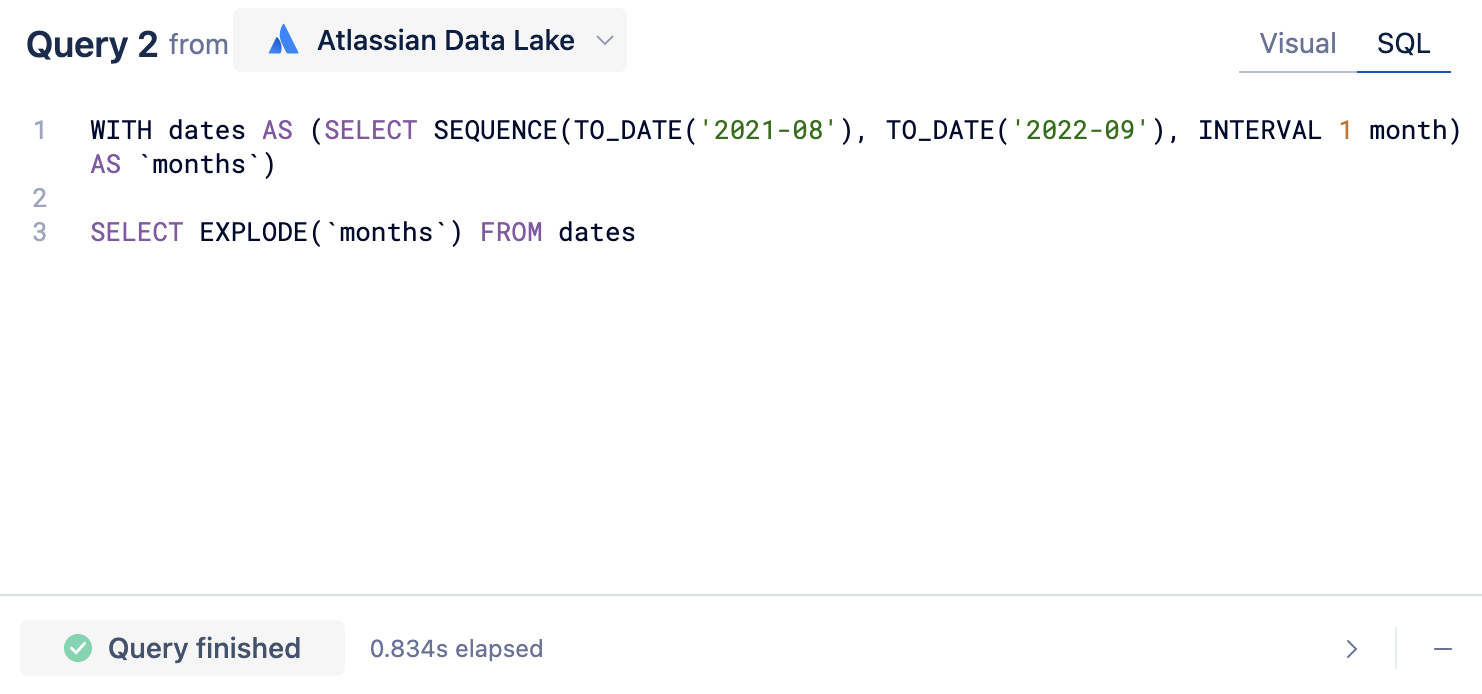
3. Staying on Query 2, use an "Apply formula"step to edit the “months” column. Select Customas the formula type and use the following SQLite formula to format the datetimes:
STRFTIME('%Y-%m',"months")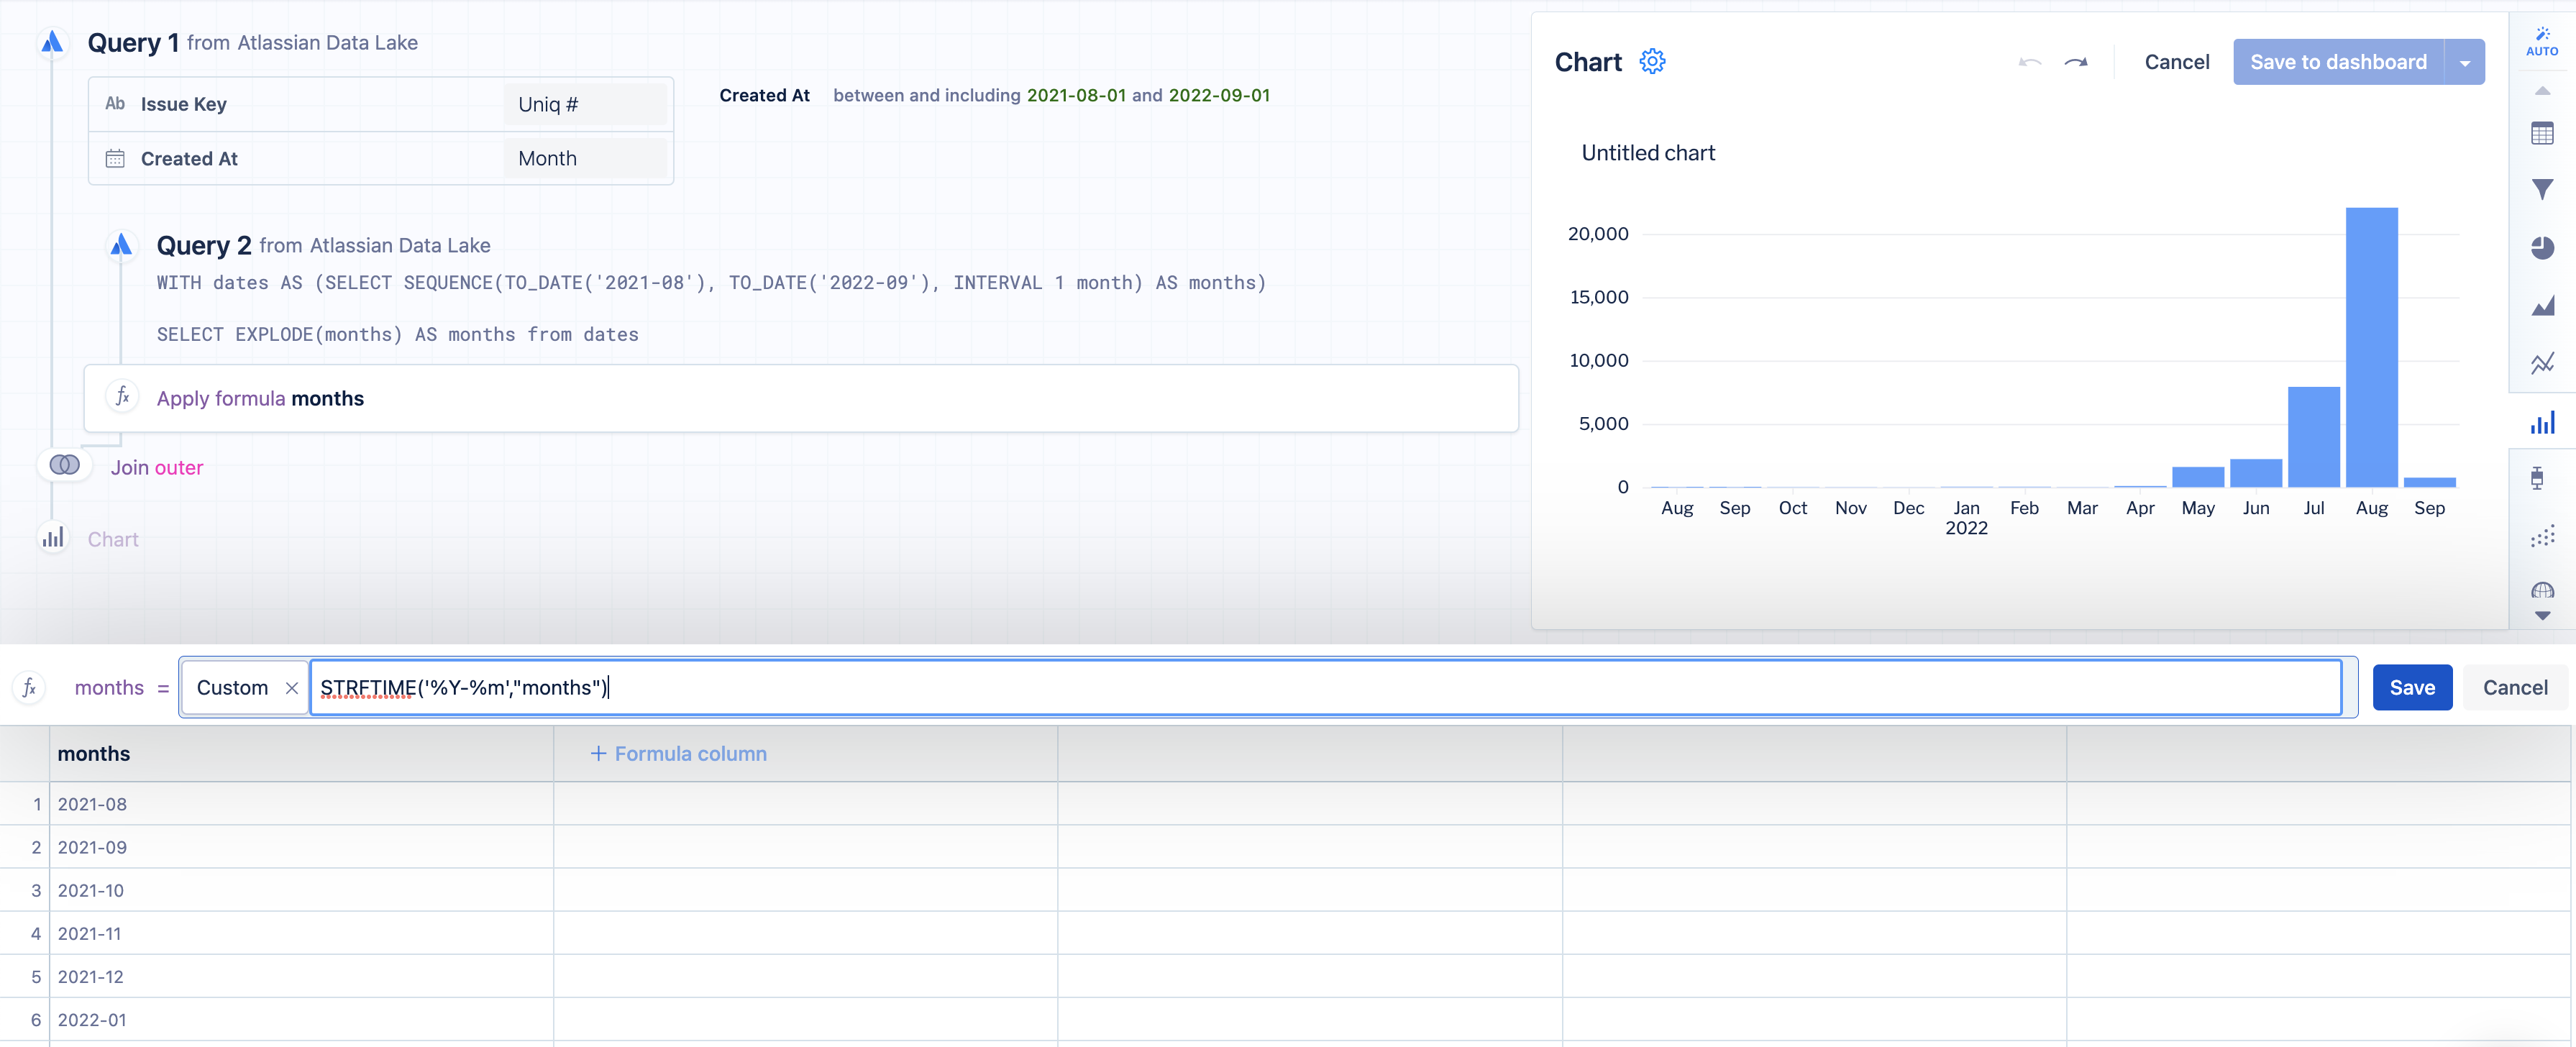
4. Still working on Query 2—Add a "Formula column" step, select Custom for the formula type again, and use the following CASEstatement:
CASE
WHEN "months"='2021-08' THEN 5
WHEN "months"='2021-09' THEN 10
WHEN "months"='2021-10' THEN 20
WHEN "months"='2021-11' THEN 20
WHEN "months"='2021-12' THEN 15
WHEN "months"='2022-01' THEN 35
WHEN "months"='2022-02' THEN 45
WHEN "months"='2022-03' THEN 40
WHEN "months"='2022-04' THEN 60
WHEN "months"='2022-05' THEN 1200
WHEN "months"='2022-06' THEN 2200
WHEN "months"='2022-07' THEN 8000
WHEN "months"='2022-08' THEN 20000
WHEN "months"='2022-09' THEN 8125
ELSE 0
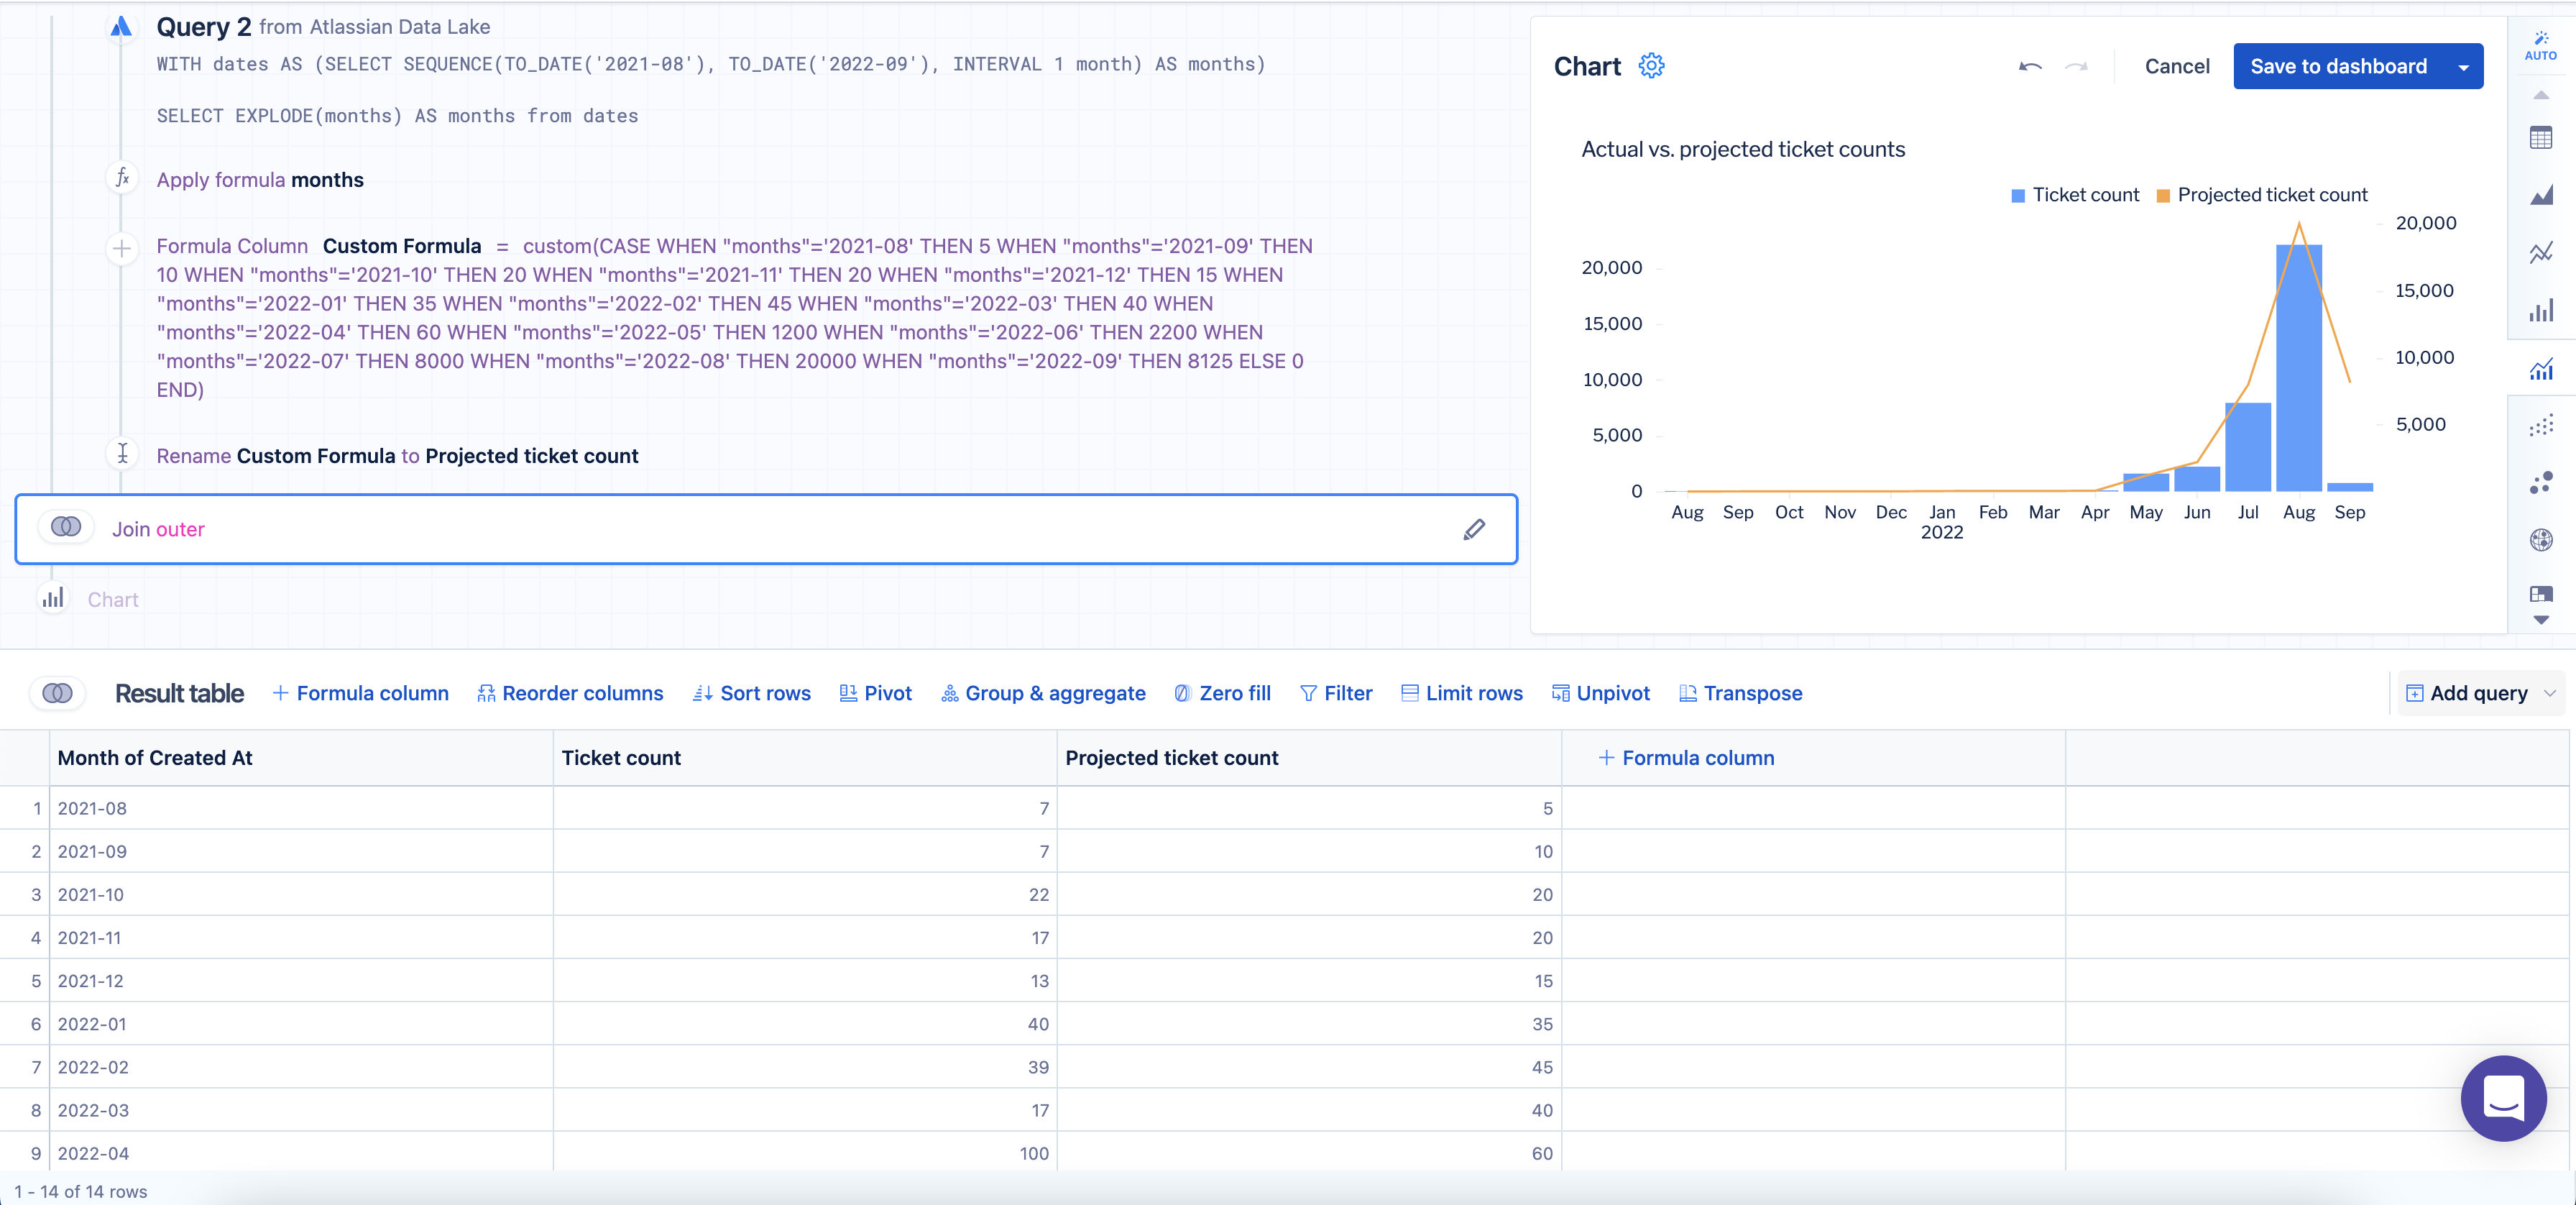
ENDThis CASEstatement assigns a corresponding static forecast amount to each month of the year. Use whatever static values you'd like for this example!
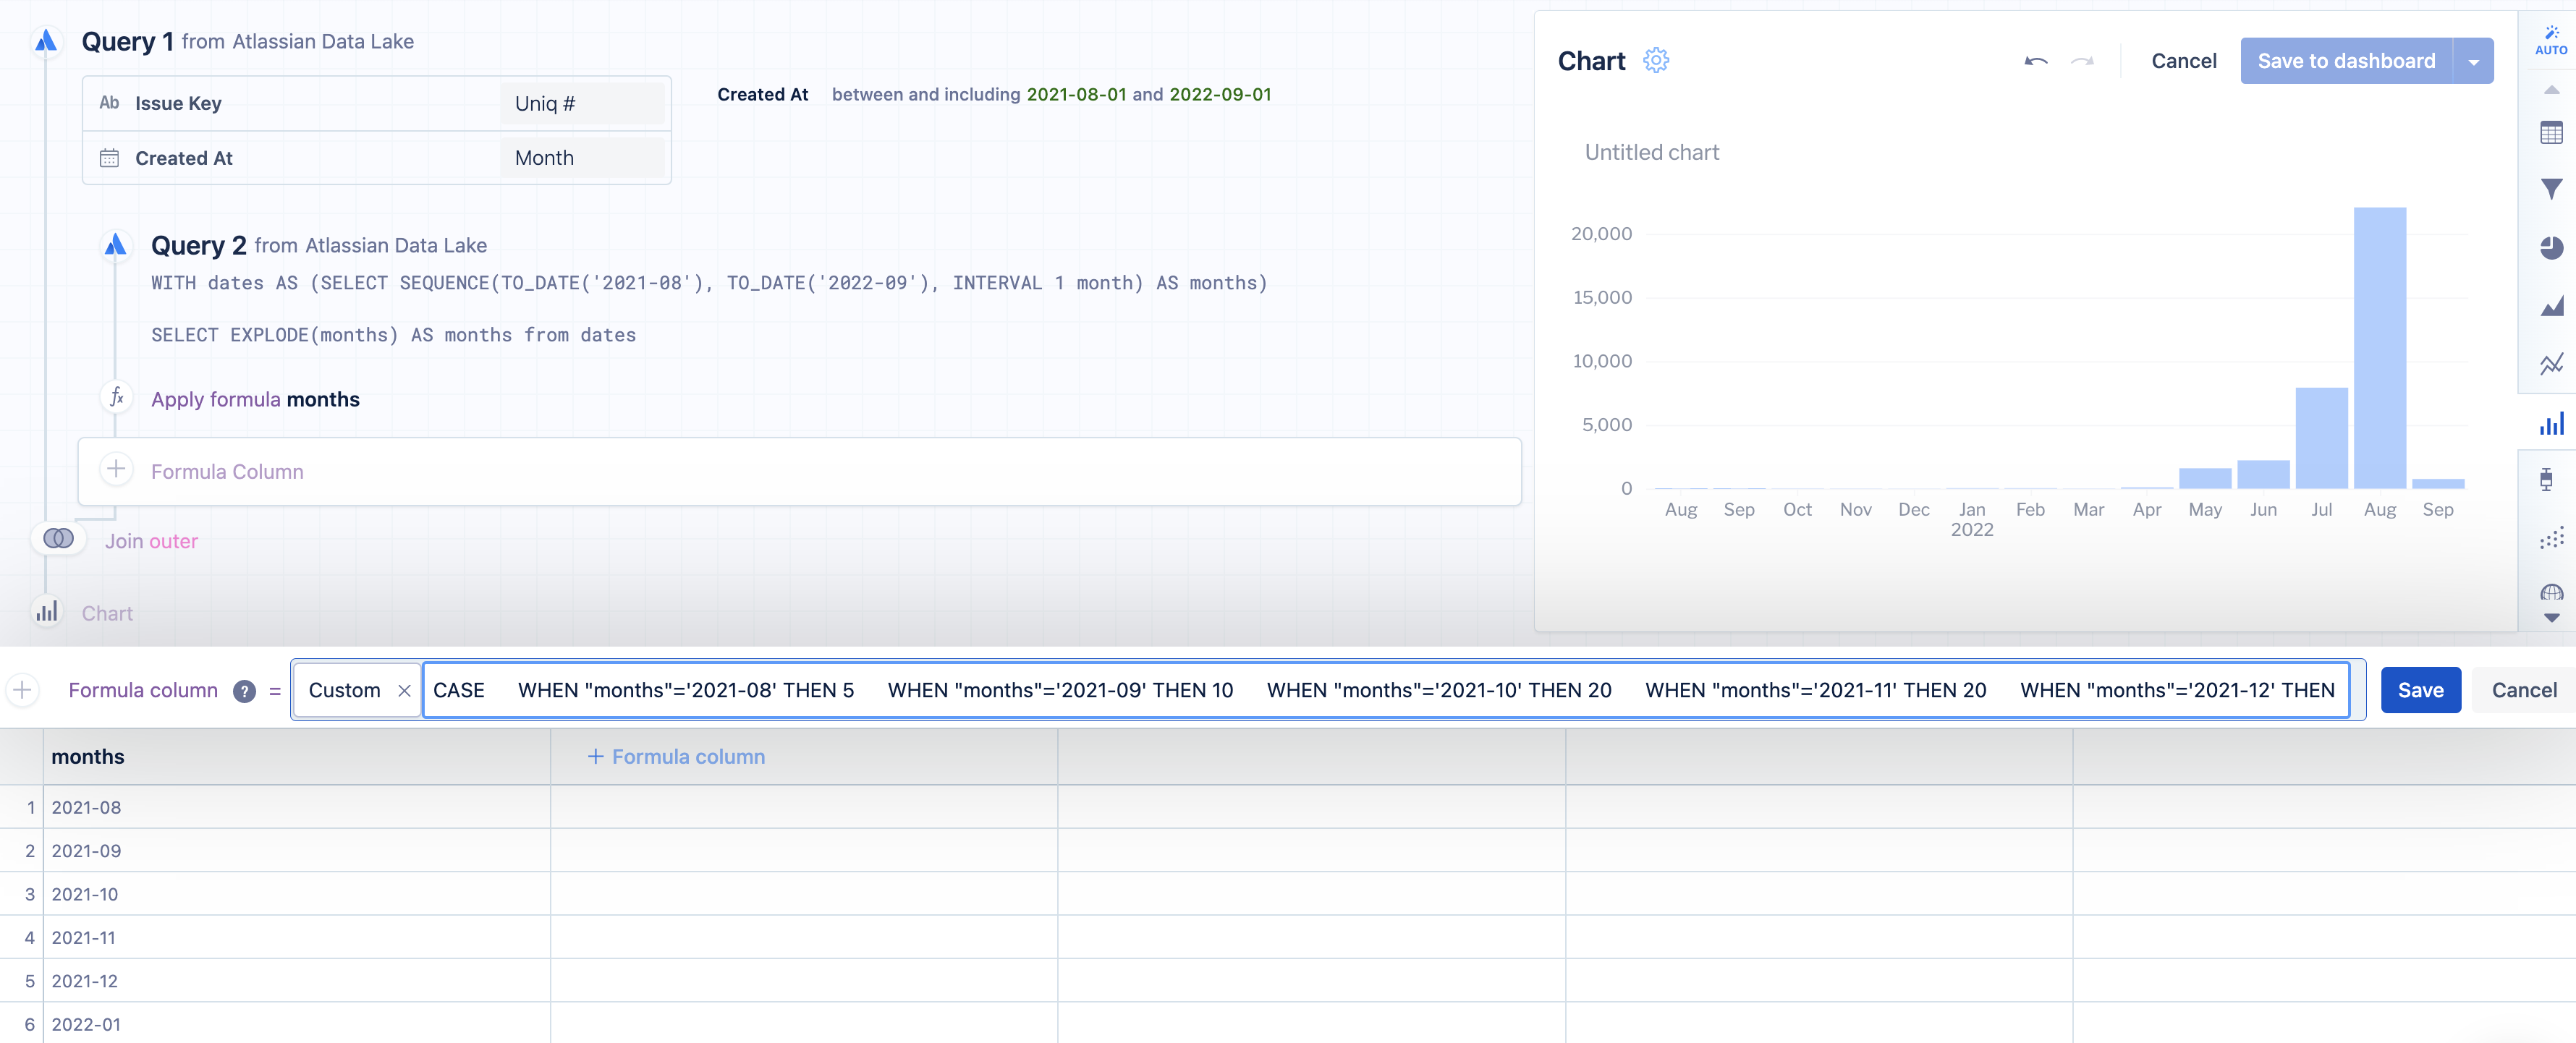
Make sure the years and months in this step correlate with the dates of your data in Query 1 and Query 2.
Rename the Formula column to “Projected ticket count” for clarity.
Click the "Join" step to see the final merge results. Leave the join type as Outer Join.
Change your chart to a Bar line chart and adjust the chart settings as needed.
Was this helpful?