Create “Dropdown” controls with values not in your database
Platform Notice: Cloud Only - This article only applies to Atlassian apps on the cloud platform.
Summary
There may be times where you need to add values to your charts or variable controls that aren’t present in your data source. To address this, you may want to add a column or rows in Atlassian Analytics directly.
In this example, we have a table chart listing out numeric values and bucketing those numbers by numerical range. We want to filter the chart by the custom buckets in our chart that aren’t found in our database.
To do this, we’ll create a “Dropdown” control with the same buckets we created in our chart, then connect it to the chart following the steps below.
Solution
Create a custom “Dropdown” control
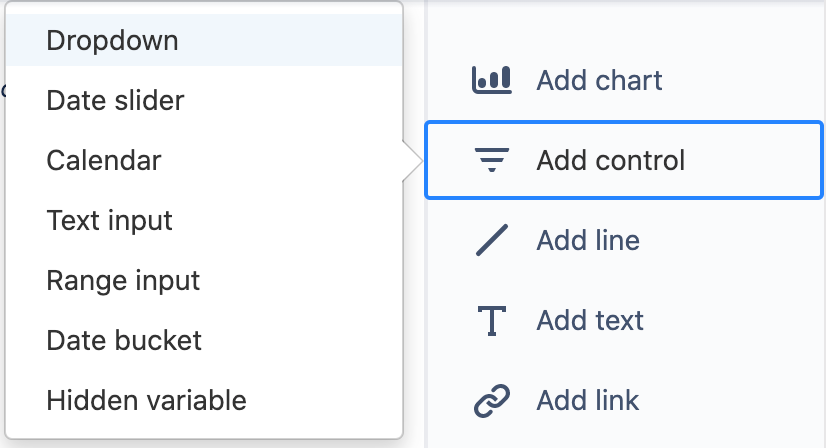
On your dashboard’s right sidebar, select Add control > Dropdown.
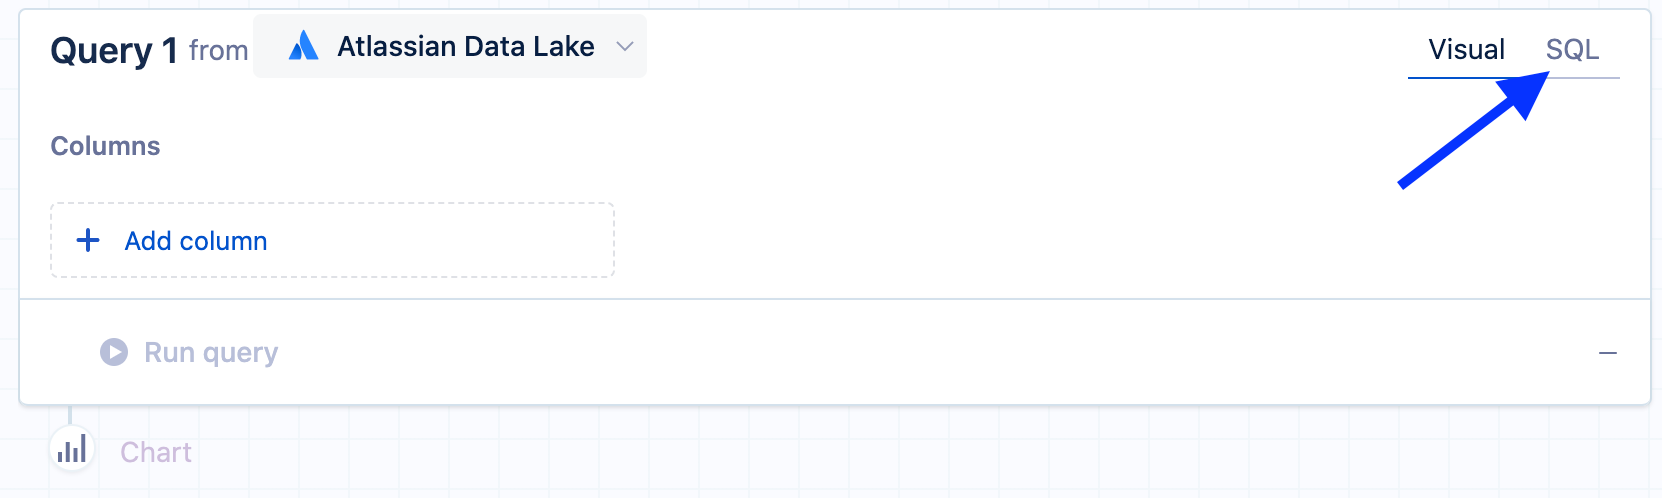
In your “Dropdown” control’s editor, switch to SQL mode to manually enter your data. Since you’ll add data that isn’t present in your database, you can use any data source for this query. Just note you need to adjust the syntax depending on the data source type selected.
Here, we’ll query an Atlassian Data Lake data source.
Add a
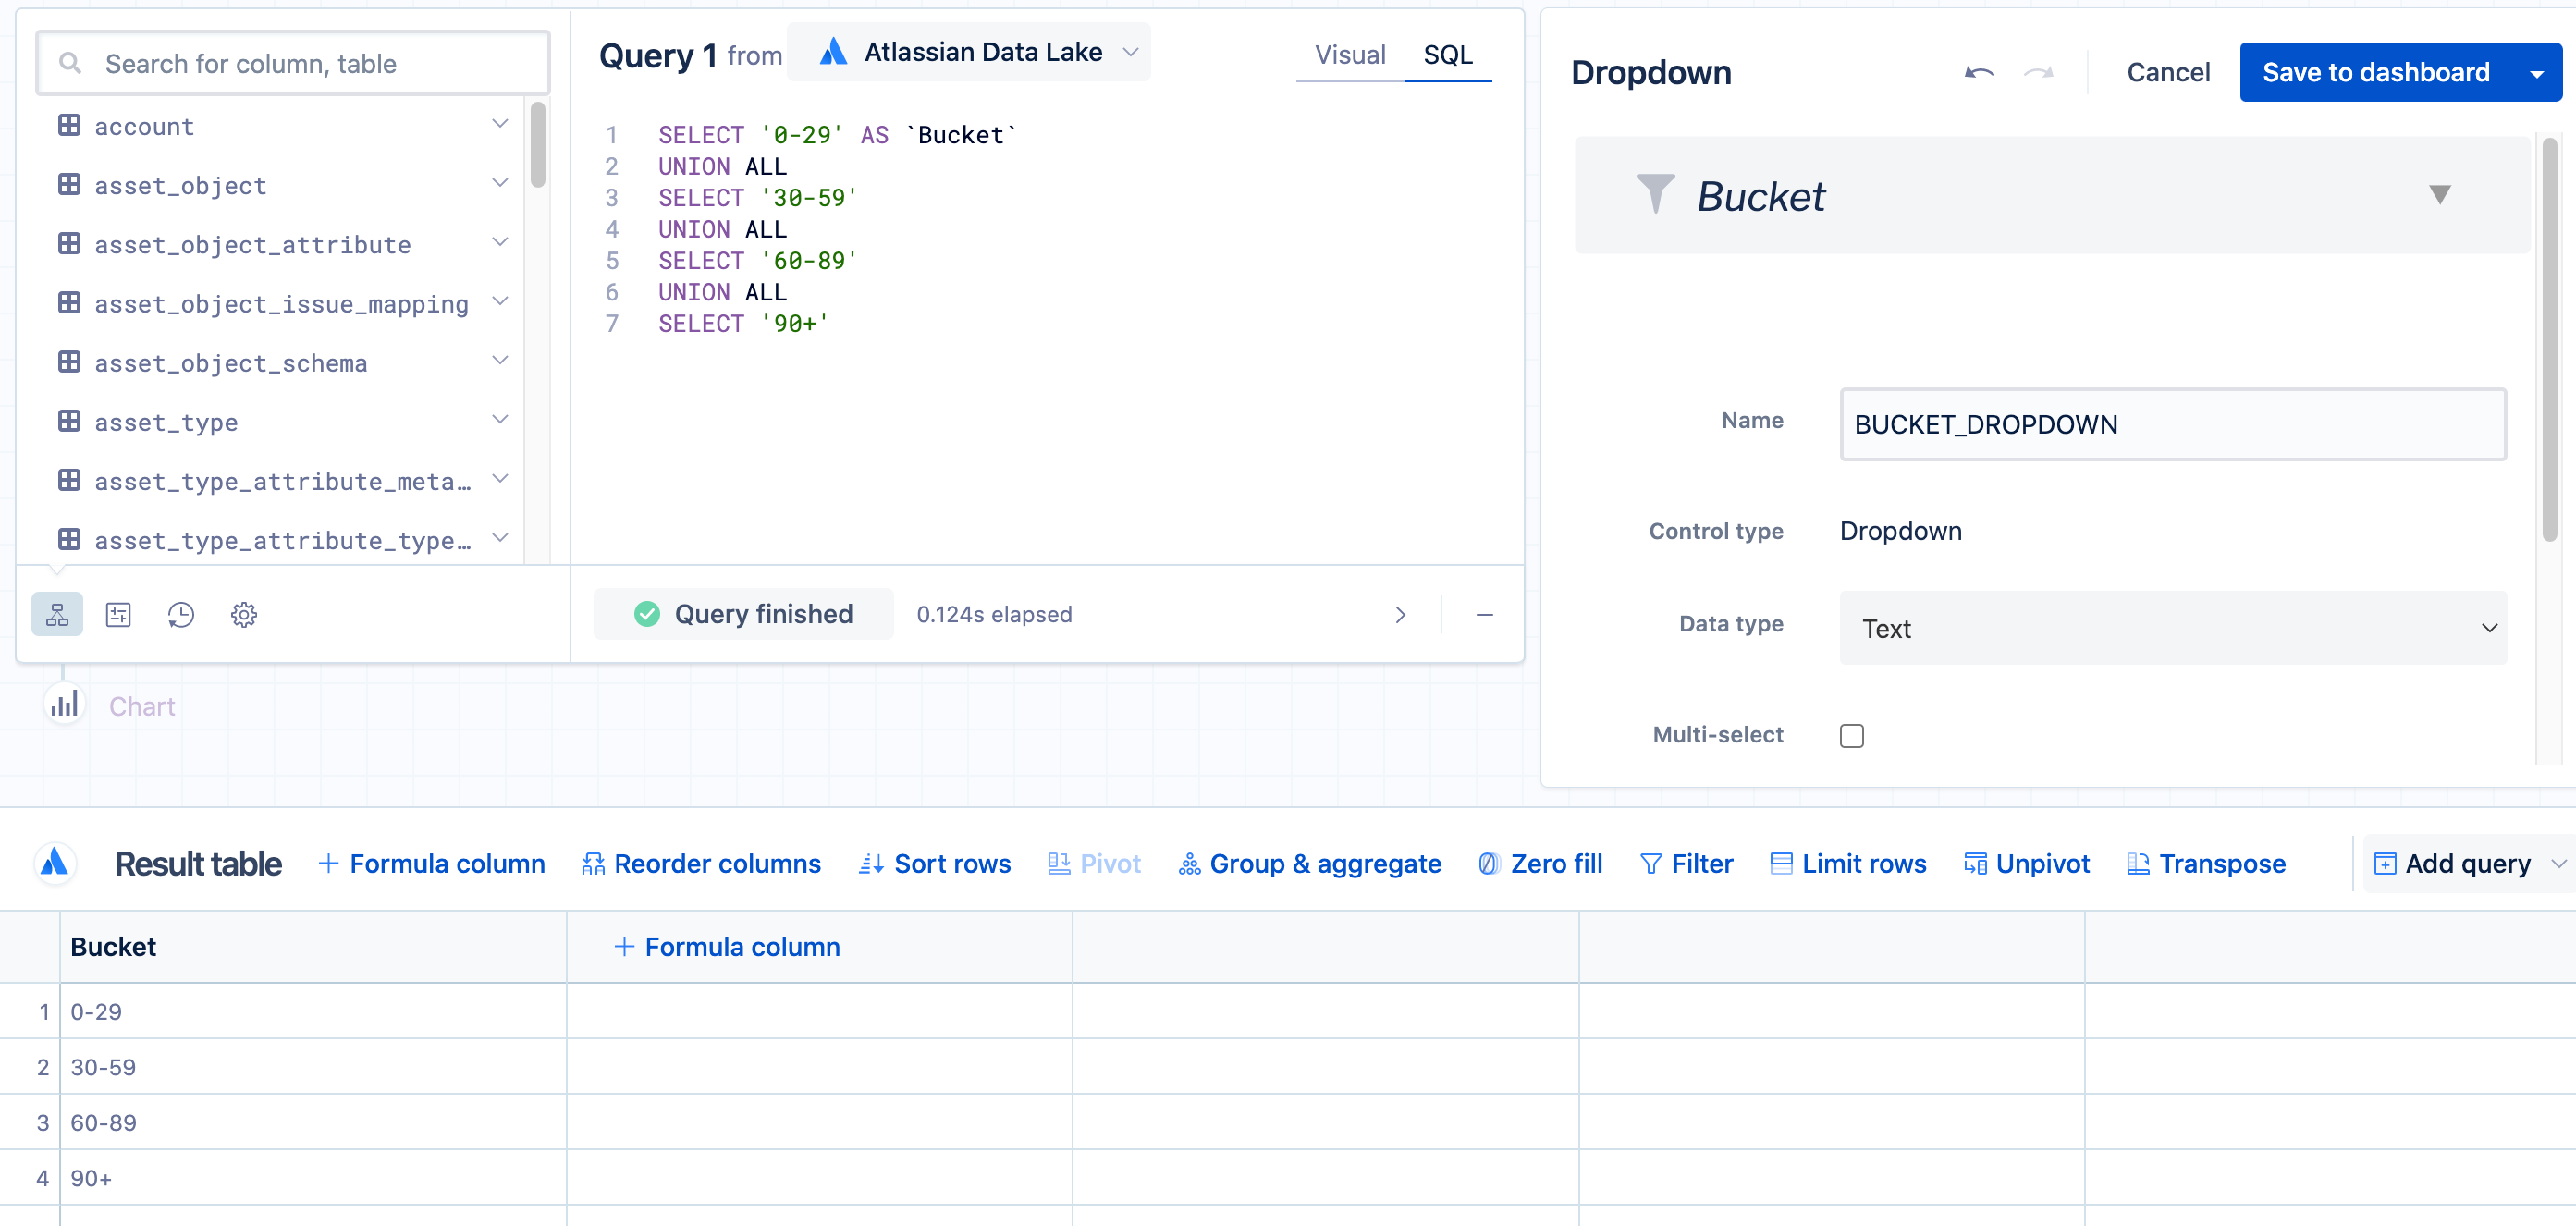
SELECTstatement, wrap the value you'd like to add in single quotes, and wrap your column name in double quotes. TheSELECTstatement should look like this:SELECT 'value' AS "column_name"Replace
valuewith your value andcolumn_namewith the name you’d like to give the new column. If you want to add multiple values within the same column, you can do so by adding aUNION ALLclause. This stacks the created values as different rows within your new column. For example:SELECT '0-29' AS `Bucket` UNION ALL SELECT '30-59' UNION ALL SELECT '60-89' UNION ALL SELECT '90+'Once you’ve added the desired values for your “Dropdown” control, fill out the rest of the control settings, then save your control to your dashboard and arrange it where you’d like.
Link the “Dropdown” control to your chart
Once you’ve created your custom “Dropdown” control, you need to link it to your chart. Depending on how your chart is set up, you can connect the control to your chart in one of two ways:
1. Add your “Dropdown” control as a filter in the initial query
From your visual mode query, if the data matches values that can be found in your data source you can filter it directly by the variable control.
2. Add it using a “Filter” step
In this example, since the buckets are created in Visual SQL, we’ll add the filter after the query.
Open the chart editor by clicking on the ellipsis on the top-right corner of your chart and click Edit chart from the menu.
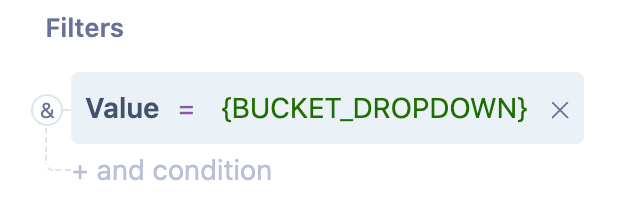
Click Filter above the result table to add a “Filter” step.
Enter your filter conditions, wrapping your custom control’s name in curly brackets (e.g.
{DROPDOWN_NAME}).
And there you have it—you can now use your custom “Dropdown” control to filter your chart.
Was this helpful?