Use Windows Process Explorer to troubleshoot Jira server Performance
Platform Notice: Data Center Only - This article only applies to Atlassian apps on the Data Center platform.
Note that this KB was created for the Data Center version of the product. Data Center KBs for non-Data-Center-specific features may also work for Server versions of the product, however they have not been tested. Support for Server* products ended on February 15th 2024. If you are running a Server product, you can visit the Atlassian Server end of support announcement to review your migration options.
*Except Fisheye and Crucible
Overview
This article outlines a way to analyze Jira application performance using Process Explorer on Windows. You'll need to collect thread dumps and correlate that with the thread IDs from Process Explorer.
⚠️ This will only work for Windows systems and requires the use of a third-party application.
ℹ️ For *nix system please see Troubleshooting Jira performance with Thread dumps. Another option for a high level overview is Using jvmtop to analyze JIRA performance.
Environment
Jira Data Center
Setup
Download Process Explorer and run it on the server JIRA application is installed;
ℹ️This is a third-party application, and as such it's not supported by Atlassian.
Locate the
tomcat.exeprocess, which is the application server that serves JIRA application;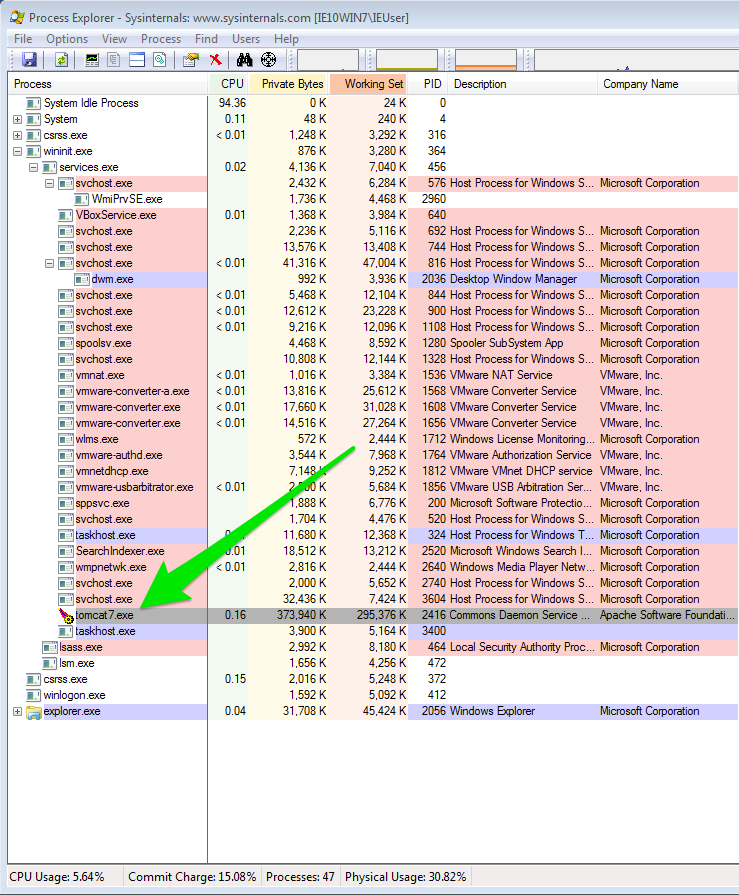
Right-click the process and select Properties.
Go to the Threads tab to get an overview of the running threads within the process.
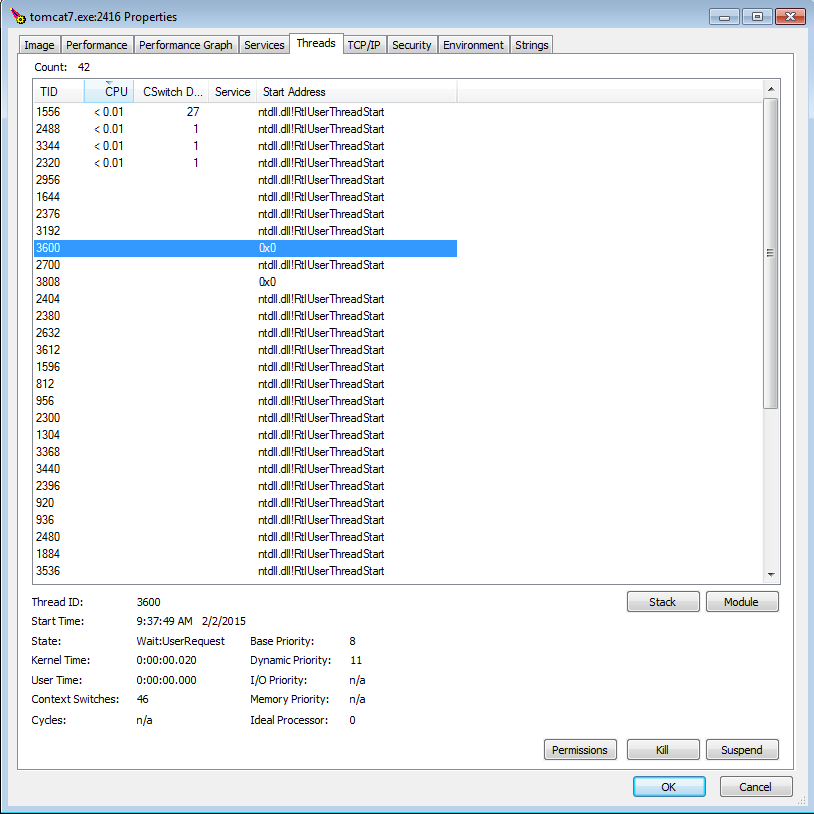
ℹ️The first column is the thread ID (TID) and the second column is the CPU utilization for each thread. Notice that the thread ID (TID) in Process Explorer is in Decimal format and corresponds to NID in the thread dumps. NID in thread dumps is in hexadecimal, so you will need to convert decimal to hexadecimal to identify those threads
With this information, we can now see which threads are consuming the most CPU and relate with what's being performed by each, as reported in the thread dumps;
Providing Information to Support
Atlassian Support may request thread dumps when troubleshooting Jira application. Adding additional information showing which threads are consuming the most CPU may considerably expedite the troubleshooting process.
Was this helpful?