Searching for a filter using Manage Filters > Search Filters in Jira Data Center returns a blank result
Platform Notice: Data Center Only - This article only applies to Atlassian apps on the Data Center platform.
Note that this KB was created for the Data Center version of the product. Data Center KBs for non-Data-Center-specific features may also work for Server versions of the product, however they have not been tested. Support for Server* products ended on February 15th 2024. If you are running a Server product, you can visit the Atlassian Server end of support announcement to review your migration options.
*Except Fisheye and Crucible
Summary
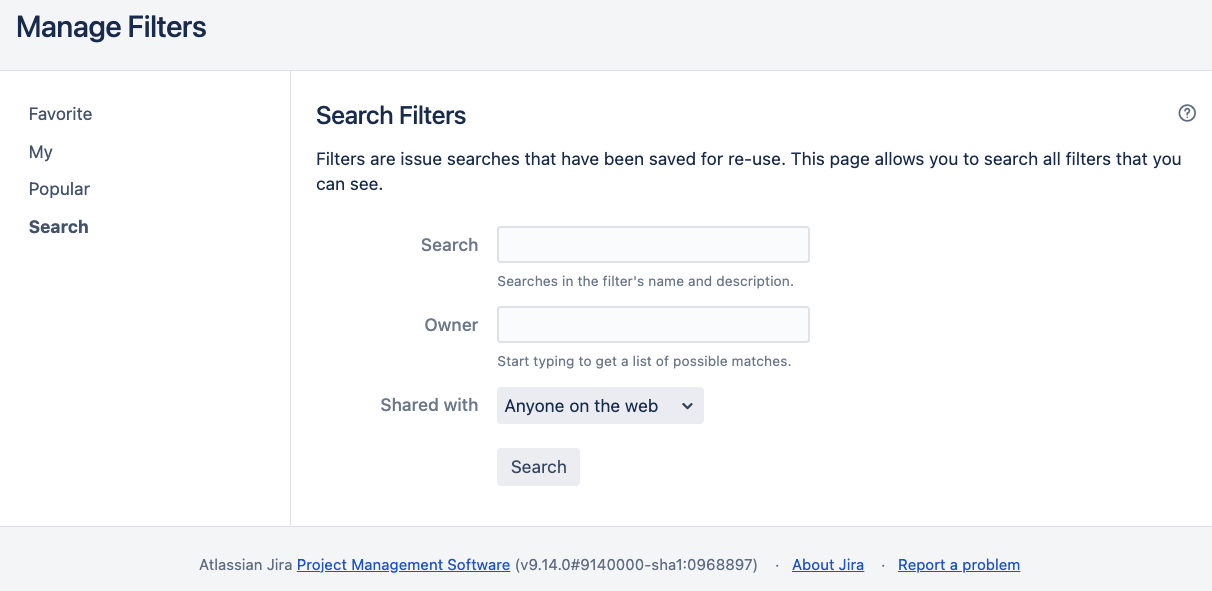
The Search button in Issues > Manage filters > Search Filters appears to have no effect when clicked, displaying no result at all (not even the normal Your search criteria did not match any filters message when a search fails to find any filters):
Environment
Jira Data Center or Server using a reverse proxy.
Diagnosis
This problem does not generate any log entries either in the JavaScript console or the Jira application log. However, if the Jira HTTP dump log is enabled then request parameters similar to the following will be observed, with what appear to be duplicate search parameter keys:
        Request URL Parameters :
                search=search
[...]
                search=Search
Bypassing the reverse proxy causes the search to function normally.
Cause
Jira's filter search uses two distinct query parameters, search=search and Search=Search. They are case-sensitive and both are required for the search to function correctly.
Some reverse proxies may normalise the query parameter keys, converting Search=Search into search=Search. This causes the search to fail.
Solution
Change the reverse proxy configuration not to modify query parameter keys.
Was this helpful?