Live monitoring using the JMX interface for specific Jira JMX metrics.
Platform Notice: Data Center Only - This article only applies to Atlassian apps on the Data Center platform.
Note that this KB was created for the Data Center version of the product. Data Center KBs for non-Data-Center-specific features may also work for Server versions of the product, however they have not been tested. Support for Server* products ended on February 15th 2024. If you are running a Server product, you can visit the Atlassian Server end of support announcement to review your migration options.
*Except Fisheye and Crucible
Important supportability disclaimer!
Customizations like these are not supported by Atlassian(in any support offer) and should be used at the Jira Admins' own discretion and risk.
You may find support from fellow users in the Community or through the services provided by Atlassian Solution Partners. This article only offers some best practices should you really need to implement something like this.
Summary
In this article we are going to discuss a scenario where we can send specific JMX metrics for monitoring.
Environment
Jira 9.x
Diagnosis
Monitor application performancedescribes how we can configure JMX exporter and also provides an example of configuration file for the exporter.
Create a configuration file for the exporter. You can download an example file from our repository. For more information on the configuration options see the README.md.
However pattern provided in this example acts as a catch-all, ensuring that even lines not explicitly matched by the rules are still captured.
- pattern: '.*'Solution
Live monitoring using the JMX interface lists different metrics collected by Jira DC. All of them are grouped in the
com.atlassian.jiraproperty.Thus if we want Jira JMX exporter to only capture and send issue related metrics then we can write following rule.
- pattern: 'com.atlassian.jira<type=issue\.(\w+)\.(\w+)><>(\w+)'
    name: com_atlassian_jira_issue_$1_$2_$3
    labels:
      product: "jira"
Following is complete example of configuration file which would send only specific Jira metrics like issue.worklogged.count, issue.updated.count and issue.search.count to Prometheus. Java metrics are also captured and send.
---
startDelaySeconds: 0
rules:
- pattern: '(java.lang)<type=(\w+)><>(\w+):'
name: java_lang_$2_$3
labels:
product: "jira"
- pattern: 'java.lang<type=Memory><HeapMemoryUsage>(\w+)'
name: java_lang_Memory_HeapMemoryUsage_$1
labels:
product: "jira"
- pattern: 'java.lang<name=G1 (\w+) Generation, type=GarbageCollector><>(\w+)'
name: java_lang_G1_$1_Generation_$2
labels:
product: "jira"
- pattern: 'com.atlassian.jira<type=issue\.(\w+)\.(\w+)><>(\w+)'
name: com_atlassian_jira_issue_$1_$2_$3
labels:
product: "jira"
blacklistObjectNames:
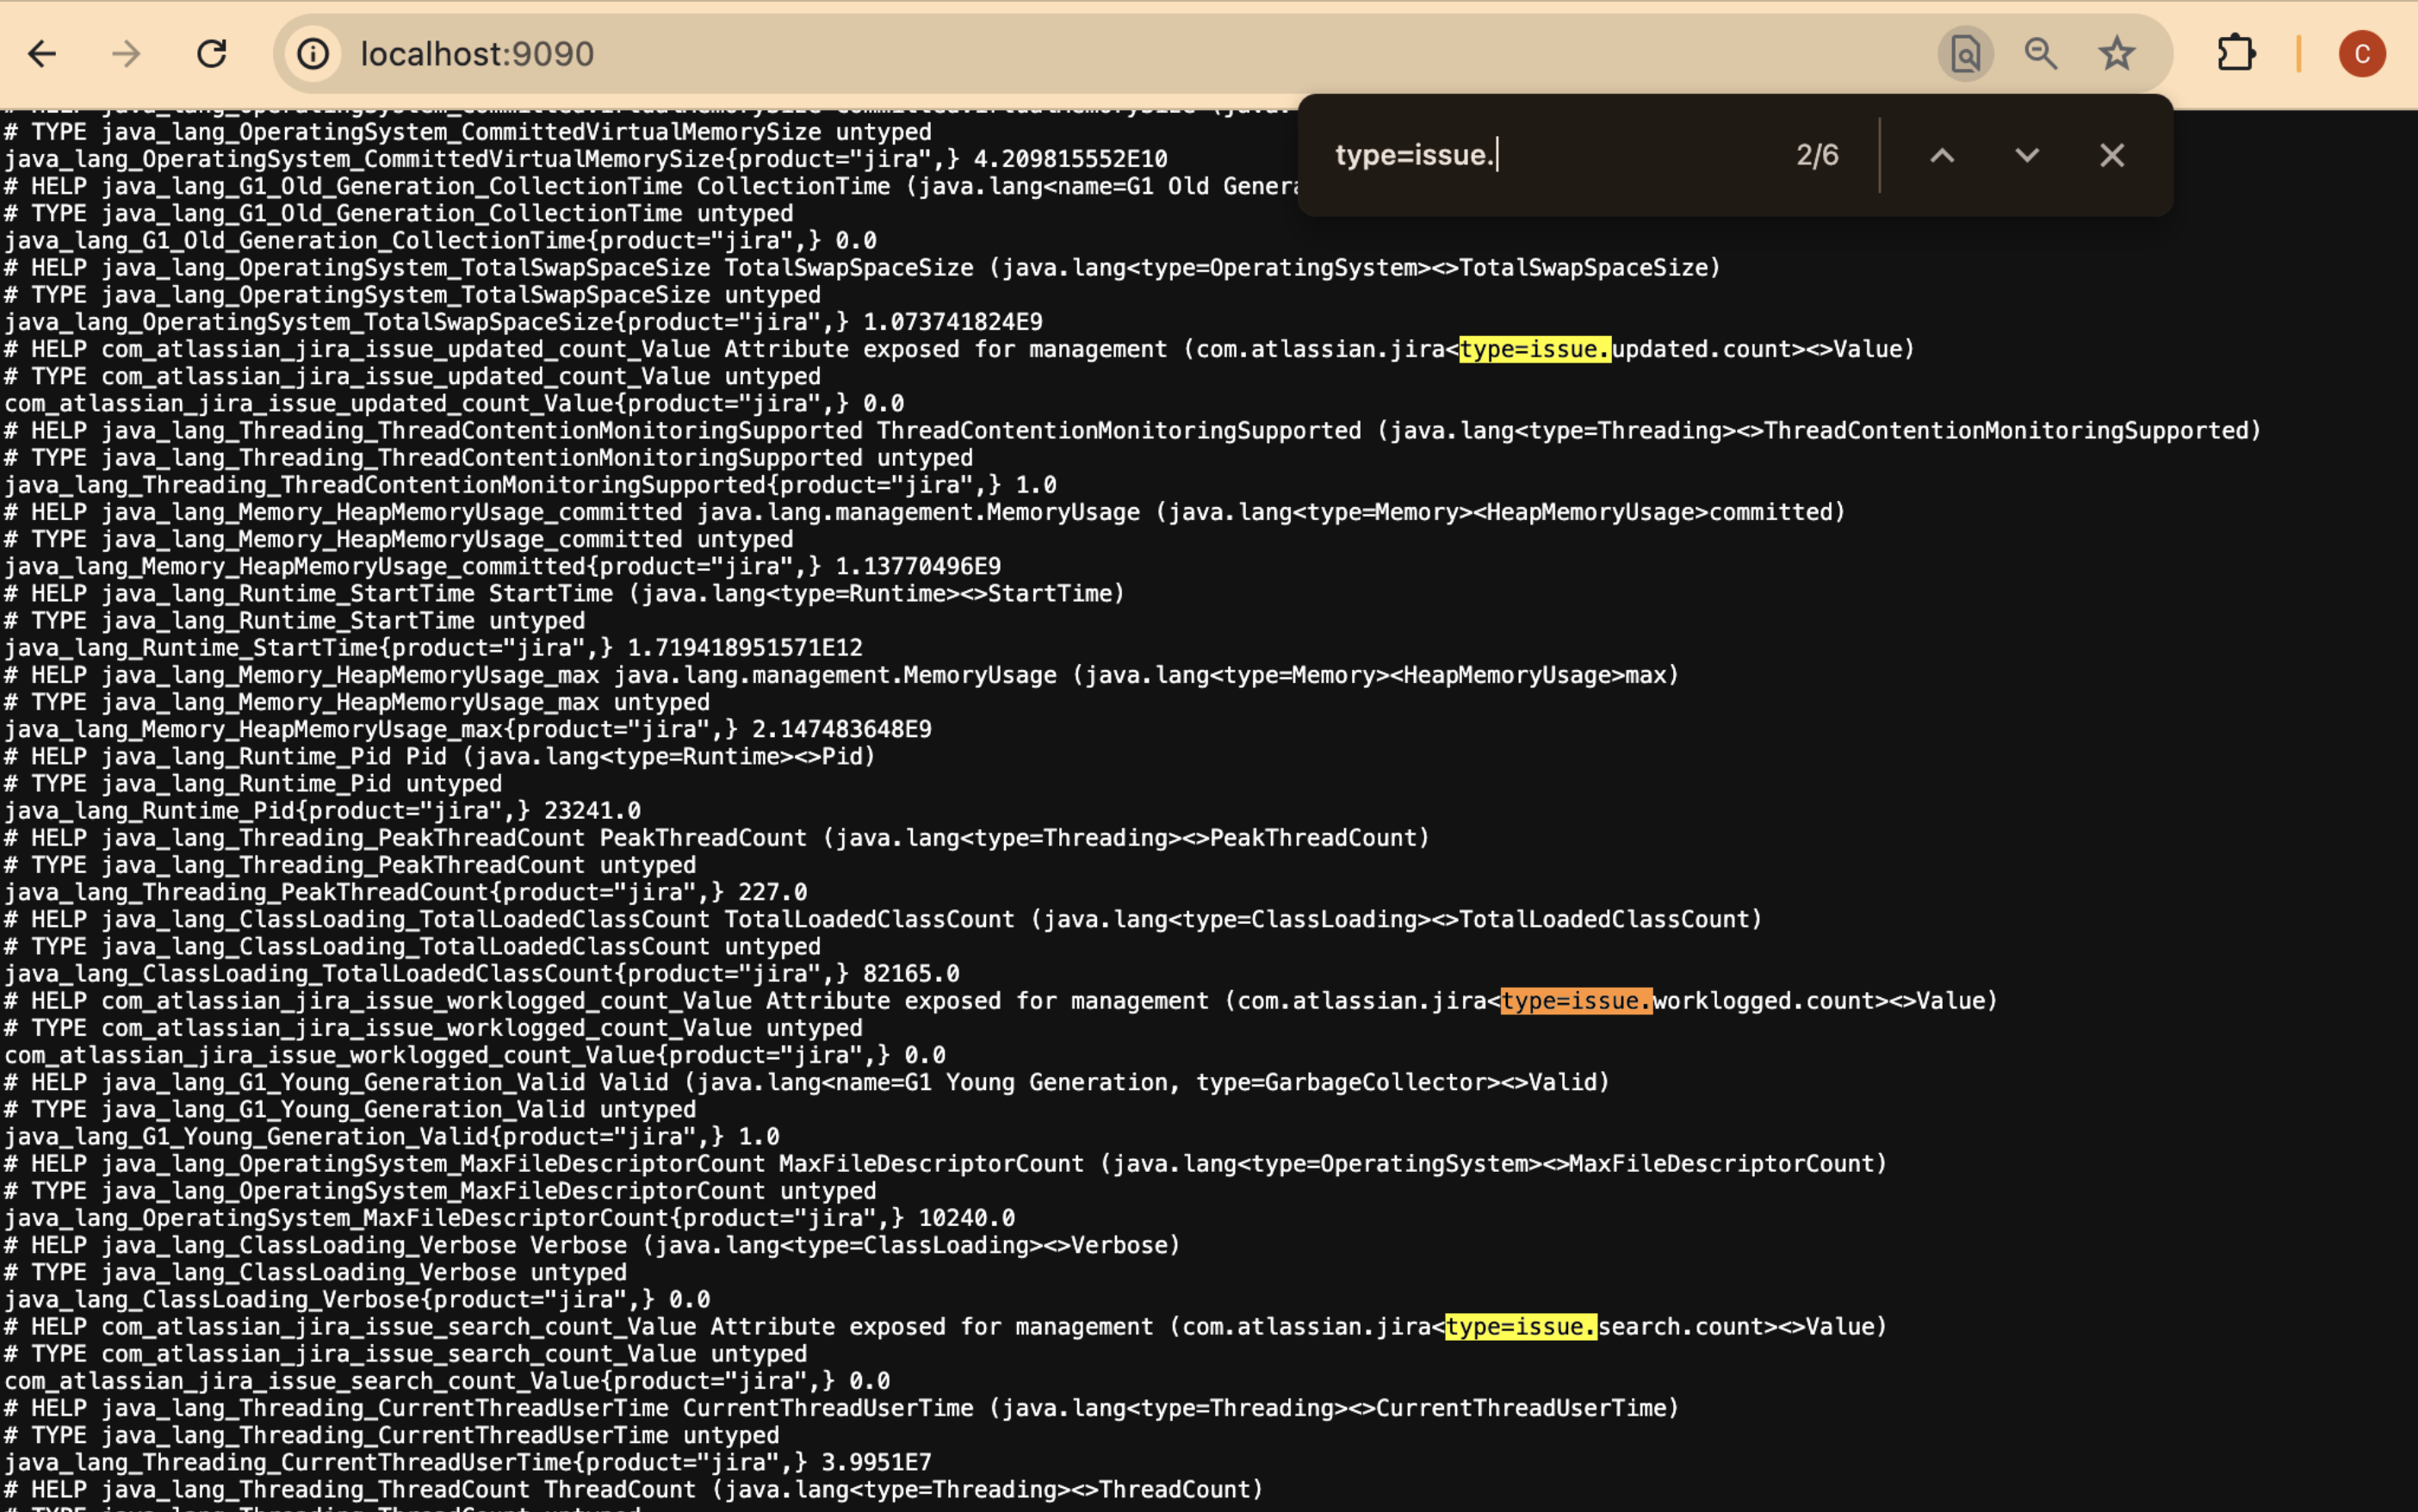
- 'com.atlassian.jira:connectionpool=connections,connection=*,name=BasicDataSource' If we browse JMX exporter which is set to 9090 port then we get following metrics. Here we can find that Jira issue related metrics are captured and can be consumed by Prometheus or Grafana Monitoring tool.
Was this helpful?