Jira Service Management Report Shows Spike At End
Platform Notice: Data Center Only - This article only applies to Atlassian apps on the Data Center platform.
Note that this KB was created for the Data Center version of the product. Data Center KBs for non-Data-Center-specific features may also work for Server versions of the product, however they have not been tested. Support for Server* products ended on February 15th 2024. If you are running a Server product, you can visit the Atlassian Server end of support announcement to review your migration options.
*Except Fisheye and Crucible
Problem
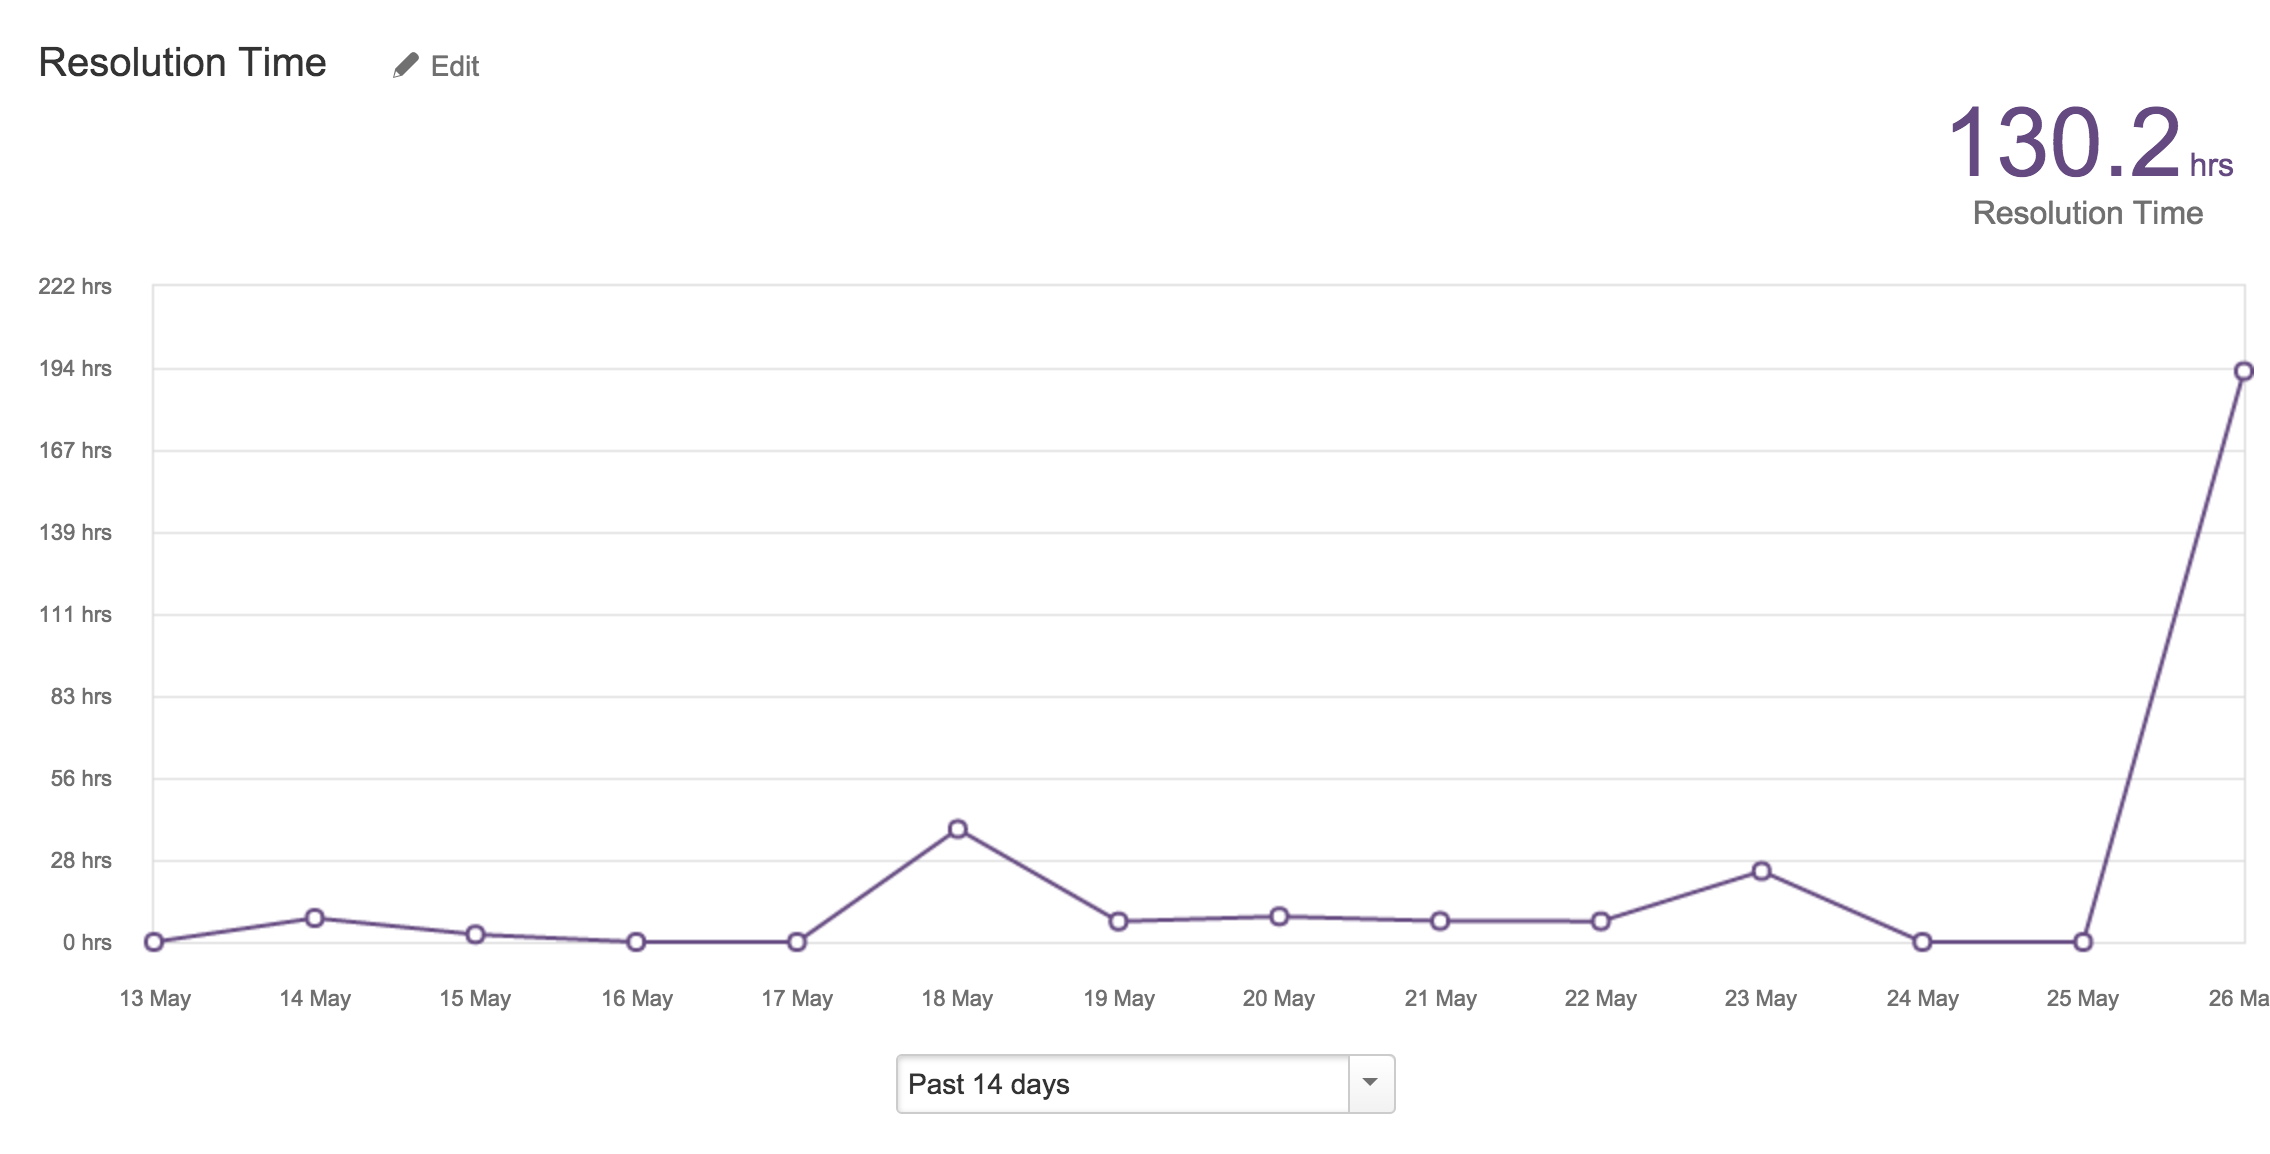
Jira Service Management reports show a spike at the end, simlar to what is seen in the following image:
Cause
The report includes issues with SLAs that are still in running state. The SLA on these issues is used to calculate the last data point.
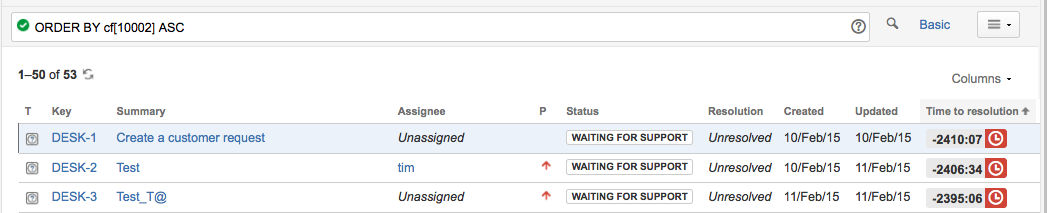
You can use Issue Navigator to identify issues with SLAs that are still running.
One way of doing this is to add the SLA as a new column and then sort by this column (ASC)
Add the column using the "Columns" dropdown then click the column name to sort
Resolution
Option 1
Change the report so that issues with SLAs that are still running are not included in the report.
You can use JQL to exclude issues with SLAs that are still running.
For example, if your SLA is "Time to Resolution" you would want to exclude issues that are not resolved. You can do this using JQL "resolution is not empty". To achieve this:
Log into your Jira Service Management.
Navigate to the affected Jira Service Management Project
Click the "Reports" link in the menu on the left. If you can't see this menu, type: ']' (which will toggle this menu).
Select the Report you want to modify, for example: "Time to resolution".
Click the "Edit" button in the top right for the affected report.
Click the "Edit" link for the affected series you would want to modify. This will bring up a dialogue.
Modify the "JQL filter". If this is currently showing dropdown menu's, switch this to "Advanced" by selecting the link.
Add: resolution is not empty to this JQL filter.
Click Save in the dialogue, and then the Save button in the report page. The changes should be reflected immediately.
Option 2
Change the issues so that their SLA is no longer running
Jira Service Management will continue to include these issues when creating reports but now these issues will be included in the calculation for the day the SLA was stopped instead of being included in the calculation for the last data point
This means that you may see a spike on your chart the day that these SLAs are stopped.
Was this helpful?