Jira logs are flooded with the warning message Trying to send a LocalQCacheOp to non-existing node
Platform Notice: Data Center Only - This article only applies to Atlassian apps on the Data Center platform.
Note that this KB was created for the Data Center version of the product. Data Center KBs for non-Data-Center-specific features may also work for Server versions of the product, however they have not been tested. Support for Server* products ended on February 15th 2024. If you are running a Server product, you can visit the Atlassian Server end of support announcement to review your migration options.
*Except Fisheye and Crucible
Summary
Jira atlassian-jira.log is flooded on the active nodes with warning messages about replication attempts to a removed node (no longer available in the cluster). These messages are constantly repeated every 5 seconds and can't be stopped until the active nodes are restarted. Below is a log excerpt from an active node trying to replicate the cache to 'jira-node1' which was removed from cluster:
2024-02-06 23:52:09,541+0000 localq-reader-18 WARN [c.a.j.c.distribution.localq.LocalQCacheOpReader] [LOCALQ] [VIA-COPY] Trying to send a LocalQCacheOp to non-existing node: jira-node1Environment
Jira 8.10+, Jira 9.x.
Diagnosis
The node referred to in the warning messages does not appear on the admin page under Administration ⚙ > System > Clustering nor is it found within the clusternodedatabase table content.
Cause
Starting from version 8.10, Jira has an automatic mechanism for removing stale nodes.Before this update, it was necessary to either utilize the REST API or manually clear entries in the clusternode table.
The changes introduced a new logic in order to clean information about old nodes from the database:
Node life cycle 8.10:
ACTIVE → <5 minutes> → NO HEARTBEAT → <2 days> → OFFLINE→ <2 days> → GONE*
Node life cycle 8.11+:
ACTIVE → <5 minutes> →NO HEARTBEAT→ <2 hours by default (configurable)> → OFFLINE → <2 days by default (configurable)> → GONE*
*GONE is not an actual state displayed on the UI, but rather an indication that a node was removed from the cluster. It's presented in this manner to clarify the node lifecycle and enhance understanding.
Please refer to Jira cluster monitoring for additional details.
However, the current state of a node is not solely determined by the node_state from clusternode table. It also depends on a liveliness check, which other nodes in the cluster perform in real-time based on the last heartbeat_time from clusternodeheartbeat table. Here's a content example from these two tables:
clusternodeheartbeat table
  node_id   | heartbeat_time | database_time
------------+----------------+---------------
 jira-node3 |  1709645953556 | 1709645953556
 jira-node2 |  1709645955178 | 1709645955178
 jira-node1 |  1709645956329 | 1709645956329
clusternode table
  node_id   | node_state |   timestamp   |      ip      | cache_listener_port | node_build_number | node_version
------------+------------+---------------+--------------+---------------------+-------------------+--------------
 jira-node3 | ACTIVE     | 1708692025758 | fd5108185a99 |               40001 |            940014 | 9.4.14
 jira-node2 | ACTIVE     | 1708692026196 | fa3592542a48 |               40001 |            940014 | 9.4.14
 jira-node1 | OFFLINE    | 1709646072113 | 8ccc92b52dd3 |               40001 |            940014 | 9.4.14
Both of these "states" can be separately seen under Administration ⚙ > System > System Info. Here is an example:
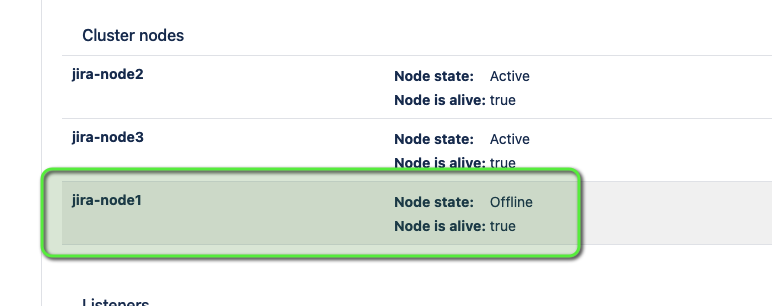
The admin page Administration ⚙ > System > Clustering combines both “node state” and “node is alive” into a unified status. Here is an example:
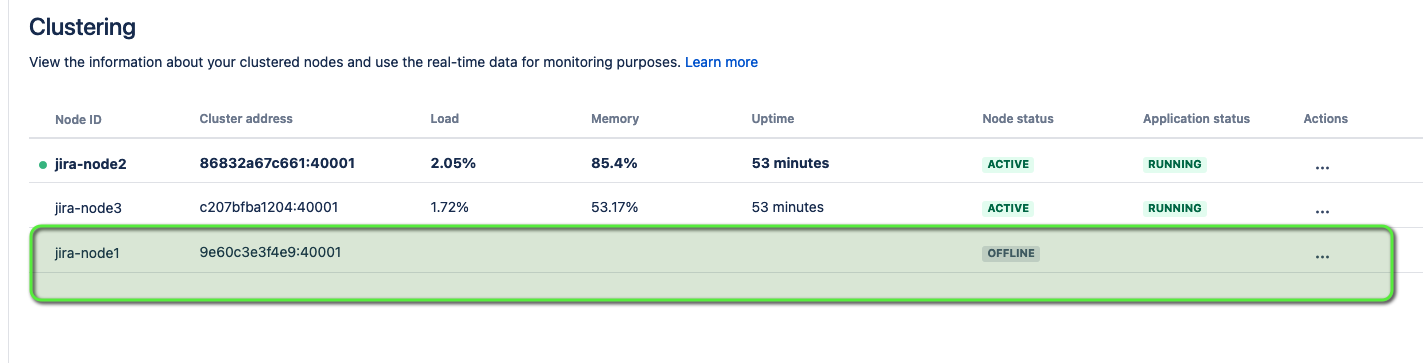
Even following a graceful shutdown (where the node switches to OFFLINE status in the clusternode table), for a subsequent period of 5 minutes, this node is still regarded as "alive". Should the record for this node be manually removed from the clusternode table while it's considered alive, it leads to local queue replication threads on other active nodes continuing their operation. These threads will not be halted by cluster watchdog services responsible for housekeeping. Consequently, this results in endlessly running threads on other active nodes attempting to replicate data to the now-removed node and generating logs filled with warnings every 5 seconds.
Workaround
As a temporary solution, in case restarting of nodes is not suitable at the moment, you can add a record for the removed node with an "OFFLINE" status back into the clusternode table:
INSERT statement example
 insert into clusternode
       (node_id,node_state,timestamp,ip,cache_listener_port,node_build_number,node_version)
 values ('jira-node1', 'OFFLINE',1709646072113,'8ccc92b52dd3',40001,940014,'9.4.14')
This will help watchdog services at active nodes to gracefully stop localq-reader-nnn threads responsible for replication.
Solution
Avoid removing node details directly from the database as a part of custom housekeeping or node shutdown scripts. The data concerning offline nodes will be automatically cleared from the database (and Clustering page) within two days. Should you need to expedite this process, please use the relevant REST API (see Remove abandoned or offline nodes in Jira Data Center).
Was this helpful?