Monitor and Troubleshoot Jira DVCS Message Stats and Queue Status
Platform Notice: Data Center Only - This article only applies to Atlassian apps on the Data Center platform.
Note that this KB was created for the Data Center version of the product. Data Center KBs for non-Data-Center-specific features may also work for Server versions of the product, however they have not been tested. Support for Server* products ended on February 15th 2024. If you are running a Server product, you can visit the Atlassian Server end of support announcement to review your migration options.
*Except Fisheye and Crucible
Summary
Environment
Jira Data Center 9.8.0 and later
Intro
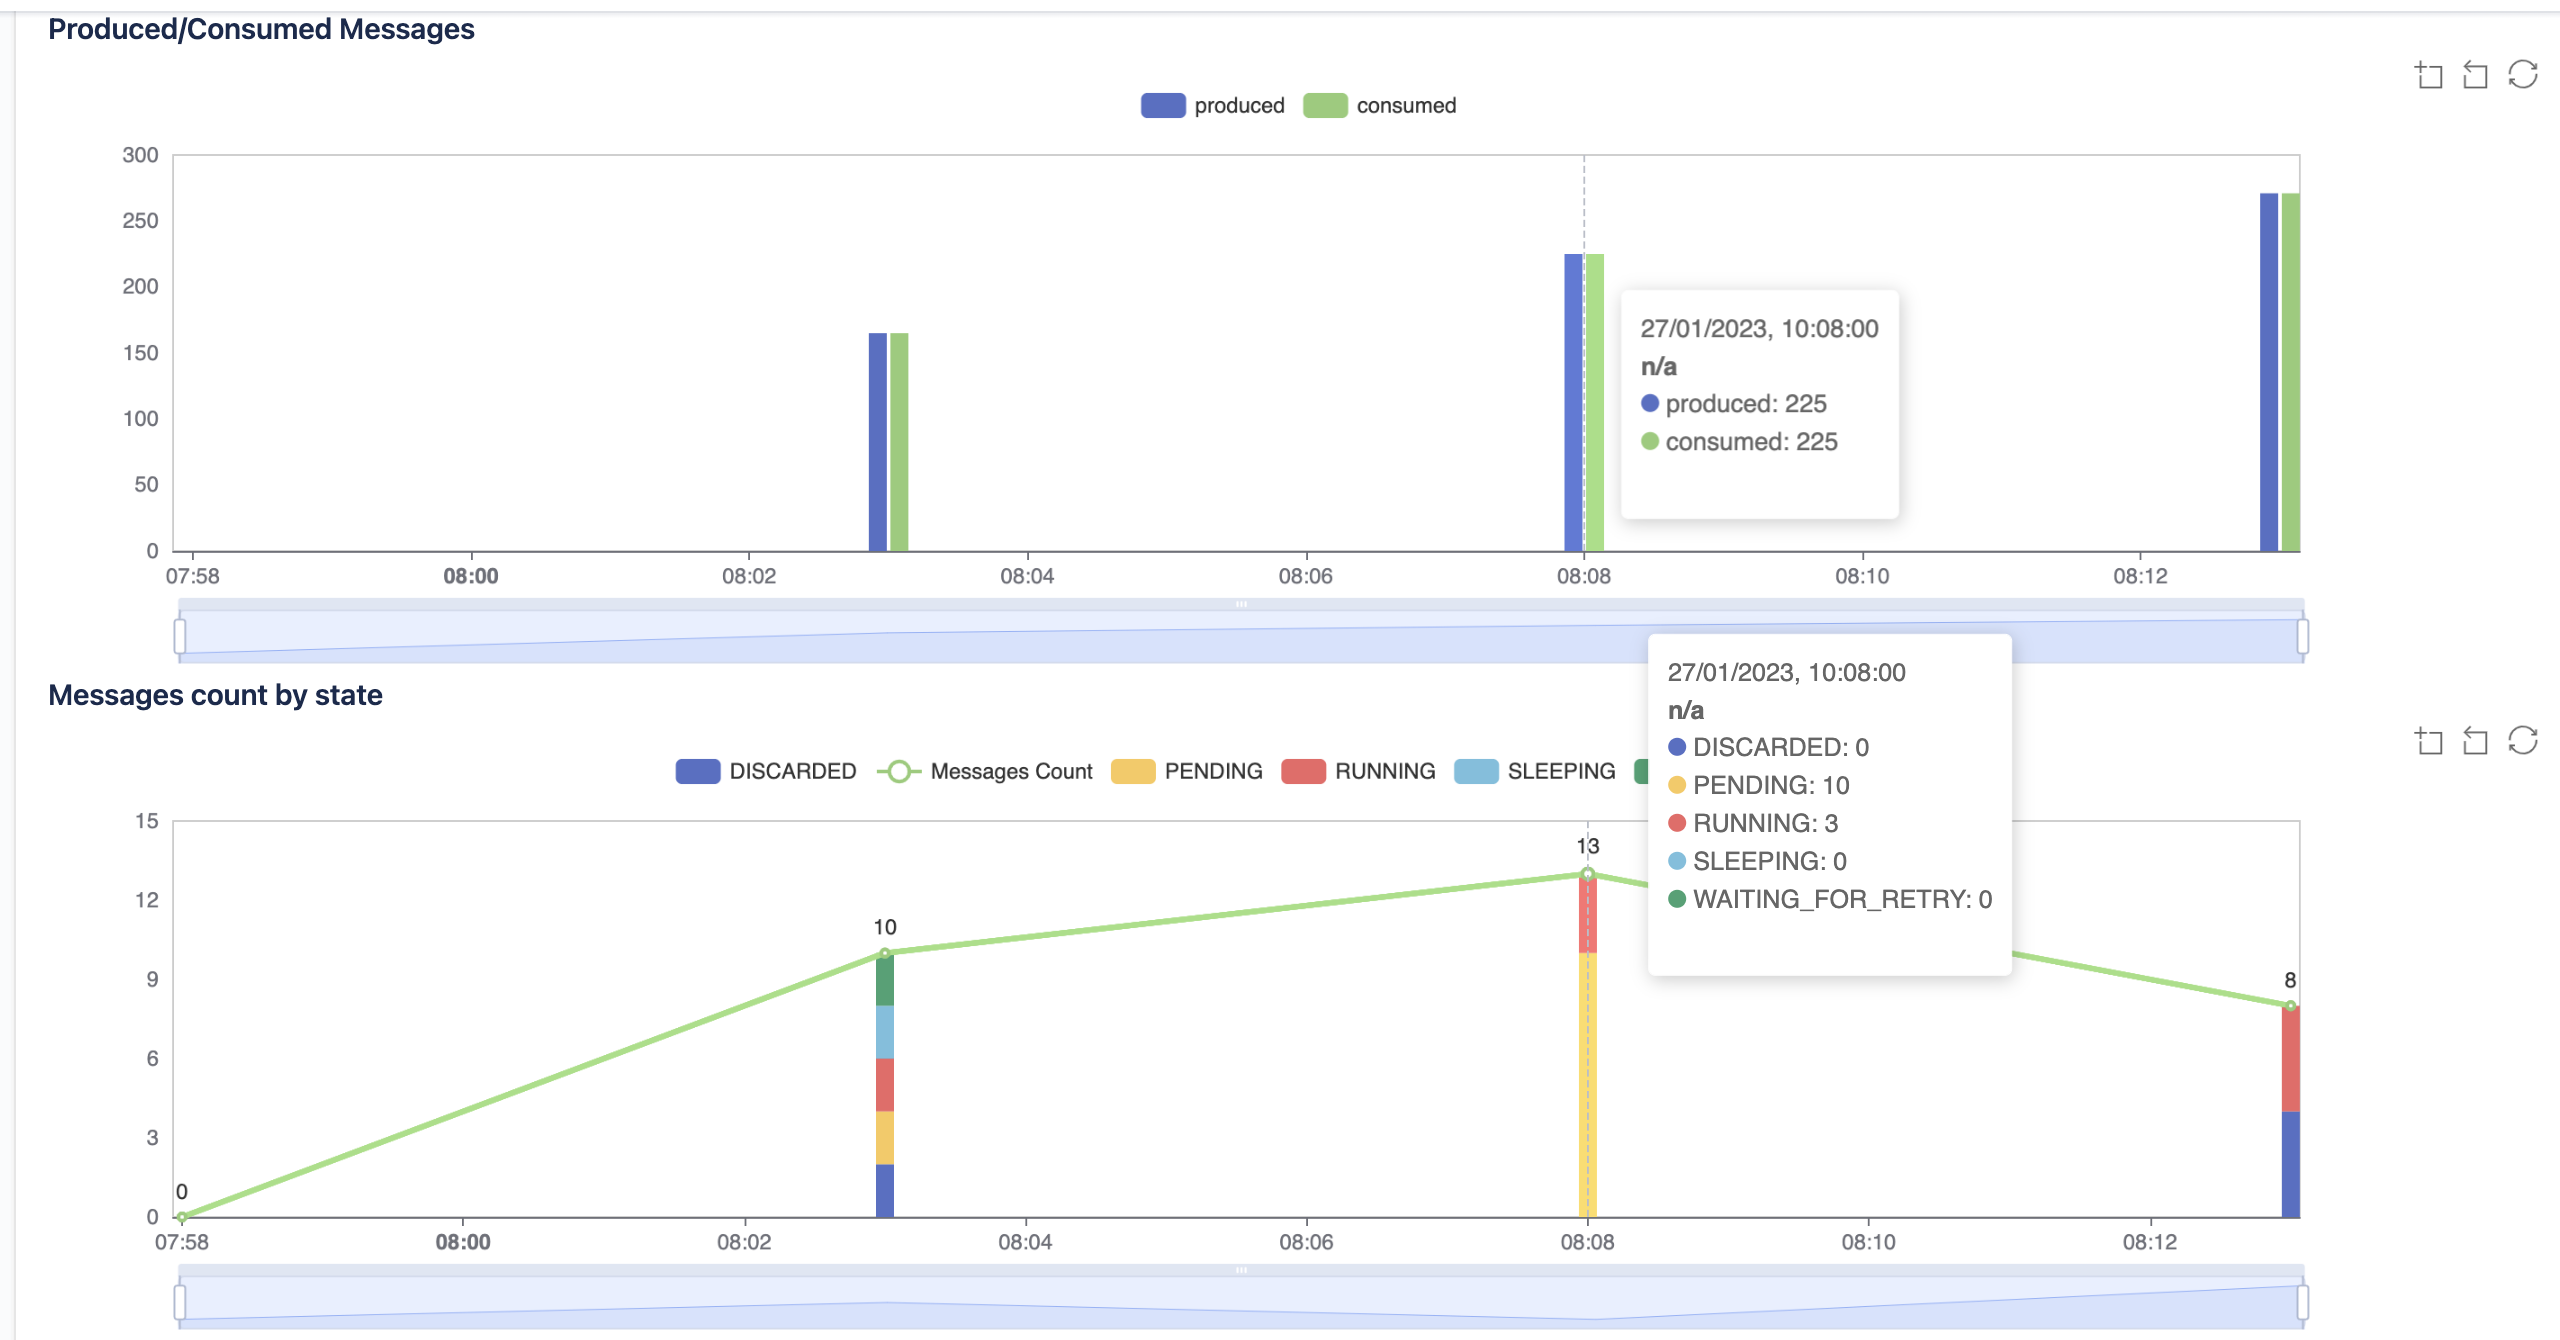
DVCS MESSAGE is statistic group, which inherit Jira-Stats behaviour and structure. It provides two logs in Jira log file (atlassian-jira.log) : snapshot measuring activity for 5min period of time and total - measuring from instance start. DVCS MESSAGE is focused on monitoring internal event processing system. Each event is represented by message. Each message is sent to message queue, where stays until is consumed. While message waits to be consumed, it holds information about it status, which can be : PENDING, RUNNING, SLEEPING, DISCARDED or WAITING_FOR_RETRY.
Logged statistics
Each node logs statistics that describe the state message queue and most active repositories. There are two types of statistics: Snapshot and Total. More detailed information can be found here: Jira stats logs.
Solution
[DVCS-MESSAGE] Stats structure
Stats can be separated to two parts - metadata about stats itself and real statistic data. Meta data about stats :
Error rendering macro 'code': Invalid value specified for parameter 'firstline'{ "_statsName": "DVCS-MESSAGE", "_statsType": "snapshot", "_time": "2023-01-26T12:20:50.272Z", "_timestamp": 1674806588000, "_duration": "PT5M0.002S", "_invocations": 495, "_statsOverhead": "n/a", "nodeId": "n/a", ..., }
Statistic data provided by DVCS-MESSAGE :
Statistics data example
{
"_statsName": "DVCS-MESSAGE",
"_statsType": "snapshot",
"_time": "2023-01-26T12:20:50.272Z",
"_timestamp": 1674806588000,
"_duration": "PT5M0.002S",
"_invocations": 495,
"_statsOverhead": "n/a",
"nodeId": "n/a",
"messageProducedInMillis": {
"count": 165,
"min": 1,
"max": 20,
"sum": 474,
"avg": 2,
"distributionCounter": {
"0": 0,
"1": 8,
"10": 156,
"100": 1,
"1000": 0,
"10000": 0
}
},
"messageConsumedInMillis": {
"count": 165,
"min": 1,
"max": 6,
"sum": 306,
"avg": 1,
"distributionCounter": {
"0": 0,
"1": 73,
"10": 92,
"100": 0,
"1000": 0,
"10000": 0
}
},
"messageConsumedSuccessfullyInMillis": {
"count": 165,
"min": 1,
"max": 6,
"sum": 303,
"avg": 1,
"distributionCounter": {
"0": 0,
"1": 74,
"10": 91,
"100": 0,
"1000": 0,
"10000": 0
}
},
"messageConsumedWithErrorInMillis": {
"count": 0,
"min": 0,
"max": 0,
"sum": 0,
"avg": 0,
"distributionCounter": {
"0": 0,
"1": 0,
"10": 0,
"100": 0,
"1000": 0,
"10000": 0
}
},
"dbMessageCount": 10,
"dbMessageCountByState": {
"SLEEPING": 2,
"WAITING_FOR_RETRY": 2,
"DISCARDED": 2,
"PENDING": 2,
"RUNNING": 2
},
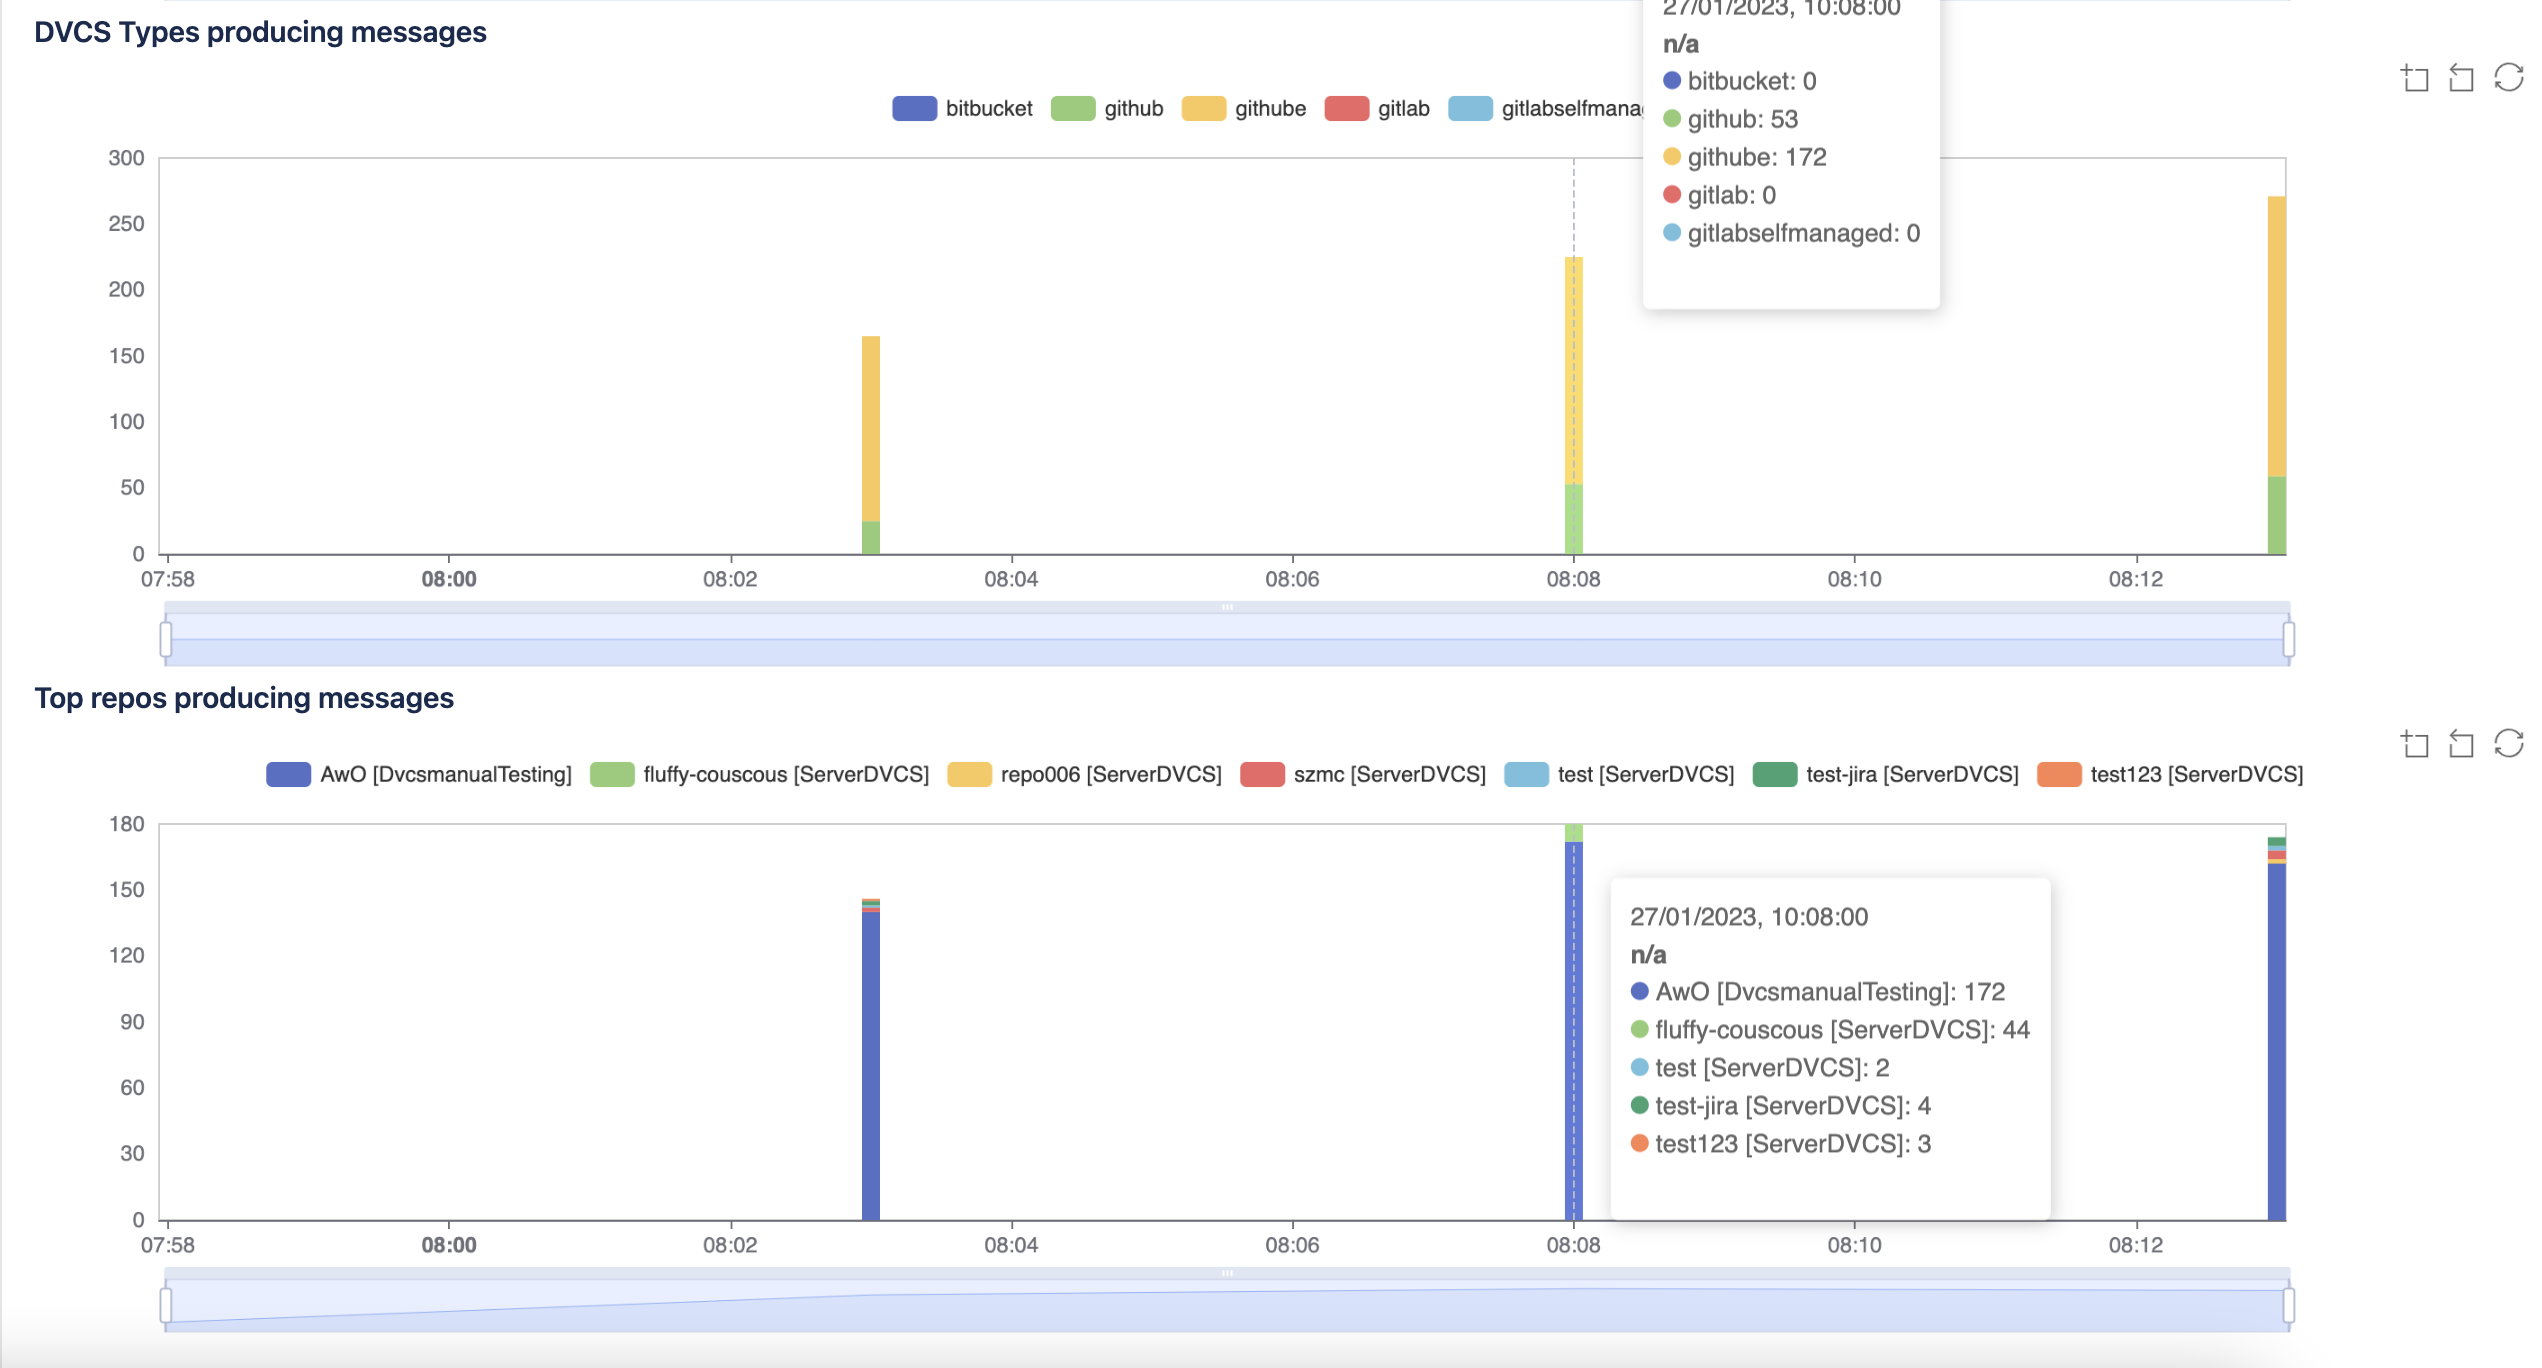
"dvcsTypesProducingMessages": {
"githube": 140,
"github": 25,
"gitlab": 0,
"bitbucket": 0,
"gitlabselfmanaged": 0
},
"topNRepositoriesProducingMessages": {
"AwO [DvcsmanualTesting]": 140,
"szmc [ServerDVCS]": 2,
"test-jira [ServerDVCS]": 2,
"test [ServerDVCS]": 1,
"test123 [ServerDVCS]": 1
}
}In this stats we are monitoring following subgroups :
*It is hard to create standards for different stats because it have dozens of dependencies:
DB type, Configuration, Hardware, OS, Organisation Size, Repositories amount, Organisation amount, Commits, Branches, HTTP traffic and many more.
Parameter | Description | Recommended value (if applicable) |
messageProducedInMillis | Count of all produced messages and time to be produced and their distribution. | N/A Assumption → less than 100 ms |
messageConsumedInMillis | Count of all consumed messages and time to be consumed and their distribution. | N/A Assumption → less than 100 ms or less than messageProducedInMillis |
messageConsumedSuccessfullyInMillis | Count of all successfully consumed messages and time to be consumed and their distribution. | N/A |
messageConsumedWithErrorInMillis | Count of all not successfully consumed messages and time to be consumed and their distribution. | N/A |
dbMessageCount | All messages in Database. | 0 - no messages are waiting to be processed again, discarded or just pending. *If there are values in this stats group doesn't mean it is problem. Example : In case repository is disabled there will be messages in sleeping state. |
dbMessageCountByState | All messages in Database grouped by status. (Described statuses in
| All groups have value 0. |
dvcsTypesProducingMessages | Count of messages produced by each git provider. | |
topNRepositoriesProducingMessages | Presenting top 10 (by default) repositories with highest activity in descending order. It is visualised as "RepoName [OrganisationName]" |
Was this helpful?