Jira Data Center node startup is slow, appearing as unresponsive due to index recovery
Platform Notice: Data Center Only - This article only applies to Atlassian apps on the Data Center platform.
Note that this KB was created for the Data Center version of the product. Data Center KBs for non-Data-Center-specific features may also work for Server versions of the product, however they have not been tested. Support for Server* products ended on February 15th 2024. If you are running a Server product, you can visit the Atlassian Server end of support announcement to review your migration options.
*Except Fisheye and Crucible
Summary
Sometimes it may take a rather large amount of time for a Jira Data Center Cluster node to startup.
The purpose of this article is to provide a high level overview why it is happening as it is very important to be able to distinguish between an unresponsive node from a node that is simply taking a while to startup.
Environment
This can happen on any Jira version. While the slowness may appear as a software failure, it is not necessarily the case especially in the following scenarios:
Scenario A: A new node is added to the cluster
Scenario B: A node is started up after prolonged period of downtime
Scenario C: A full locked re-index on one of the cluster nodes has been performed while one or all other cluster nodes were offline
Scenario D: There was an upgrade, first node was upgraded then full locked re-index performed, then another node upgraded and that 'next node' appears as unresponsive
Scenario E: There was an upgrade, and then all other cluster nodes were upgraded and started up at once
There could be other scenarios, not covered here, in all cases, please follow the Diagnosis section below to verify if the node is still starting or is indeed unresponsive
Diagnosis
After starting the node up, it might appear as unresponsive and will show on the 'Clustering' page in Jira without Load / Memory / Uptime stats and non-ACTIVE Node status. For example:
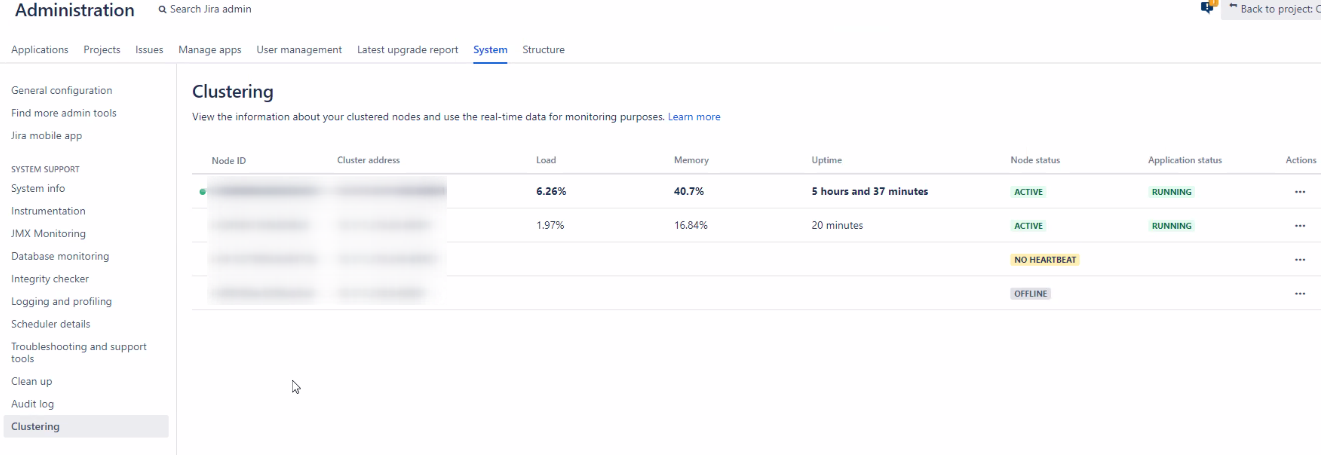
While the above may indicate a problem with the last two nodes, it could be a false positive, and the node actual state needs to be validated to confirm whether it is truly unresponsive before trying to fix it.
Step 1:
Monitor atlassian-jira.log (tail -f, or use a text editor that is able to view the log realtime in Windows (notepad++ for example can somewhat help with this)). You may find the following exceptions:
2022-10-30 10:34:27,297-0400 NodeReindexServiceThread:thread-0 INFO      [c.a.j.index.ha.DefaultNodeReindexService] [INDEX-REPLAY] Node re-index service is not running: currentNode.isClustered=true, notRunningCounter=24, paused=true, lastPausedStacktrace=java.lang.Throwable
    	at com.atlassian.jira.index.ha.DefaultNodeReindexService.pause(DefaultNodeReindexService.java:218)
    	at com.atlassian.jira.cluster.DefaultClusterManager.checkIndex(DefaultClusterManager.java:154)
    	at com.atlassian.jira.startup.ClusteringLauncher.start(ClusteringLauncher.java:37)
    	at com.atlassian.jira.startup.DefaultJiraLauncher.postDBActivated(DefaultJiraLauncher.java:166)
    	at com.atlassian.jira.startup.DefaultJiraLauncher.lambda$postDbLaunch$2(DefaultJiraLauncher.java:144)
    	at com.atlassian.jira.config.database.DatabaseConfigurationManagerImpl.doNowOrEnqueue(DatabaseConfigurationManagerImpl.java:307)
    	at com.atlassian.jira.config.database.DatabaseConfigurationManagerImpl.doNowOrWhenDatabaseActivated(DatabaseConfigurationManagerImpl.java:202)
There could be exceptions like this as well:
022-10-30 19:30:45,747-0400 localhost-startStop-1 INFO [c.a.j.c.cache.ehcache.ReplicatorFactory] [Cache-replication] Cache replication using default cache replicator: LocalQCacheReplicator
2022-10-30 19:30:46,528-0400 localq-reader-1 INFO [c.a.j.c.distribution.localq.LocalQCacheOpReader] [LOCALQ] [VIA-INVALIDATION] Checked exception: RecoverableFailure occurred when processing: LocalQCacheOp

Unknown macro: {cacheName='com.atlassian.jira.project.util.CachingProjectKeyStore.cache', action=REMOVE, key=com.atlassian.cache.impl.ReferenceKey@0, value == null ? true, replicatePutsViaCopy=false, creationTimeInMillis=1667157551614}
from cache replication queue: [queueId=queue_i041027585b8d8472b_2_b859c71de5933aa473f5b97b9042cc8c, queuePath=/var/atlassian/application-data/jira/localq/queue_i041027585b8d8472b_2_b859c71de5933aa473f5b97b9042cc8c], failuresCount: 1. Will retry indefinitely.
com.atlassian.jira.cluster.distribution.localq.LocalQCacheOpSender$RecoverableFailure: java.rmi.ConnectIOException: Exception creating connection to:XX.XX.XX.XX; nested exception is:java.net.NoRouteToHostException: No route to host (Host unreachable)
Potentially there could be other exceptions, and while they seem to indicate a potential issue, it is not necessarily the case and it is important to review what exactly Jira is doing by capturing a set of CPU and thread dumps in Step 2 below.
Step 2:
Capture a set of CPU and thread dumps (for example 6 CPU and thread dumps, 10 seconds apart, see the linked article for details) while the node appears to be hanging. Once captured, please try and identify long running and top most CPU consuming threads (feel free to reach out to Atlassian Support at this stage to assist with this).
If the node is still starting, the following threads will be evident across all the thread dumps taken
22:11:22 - localhost-startStop-1
State:RUNNABLE
CPU usage:20.0%
Running for: 3:18.51
Waiting for
This thread is not waiting for notification on any lock
Locks held
This thread holds [0x14df612940, 0x100082ce78, 0x100082ce78]
Stack trace
java.net.SocketInputStream.socketRead0(java.base@11.0.13/Native Method)
java.net.SocketInputStream.socketRead(java.base@11.0.13/Unknown Source)
java.net.SocketInputStream.read(java.base@11.0.13/Unknown Source)
java.net.SocketInputStream.read(java.base@11.0.13/Unknown Source)
sun.security.ssl.SSLSocketInputRecord.read(java.base@11.0.13/Unknown Source)
sun.security.ssl.SSLSocketInputRecord.readHeader(java.base@11.0.13/Unknown Source)
sun.security.ssl.SSLSocketInputRecord.bytesInCompletePacket(java.base@11.0.13/Unknown Source)
sun.security.ssl.SSLSocketImpl.readApplicationRecord(java.base@11.0.13/Unknown Source)
sun.security.ssl.SSLSocketImpl$AppInputStream.read(java.base@11.0.13/Unknown Source)
org.postgresql.core.VisibleBufferedInputStream.readMore(VisibleBufferedInputStream.java:161)
org.postgresql.core.VisibleBufferedInputStream.ensureBytes(VisibleBufferedInputStream.java:128)
org.postgresql.core.VisibleBufferedInputStream.ensureBytes(VisibleBufferedInputStream.java:113)
org.postgresql.core.VisibleBufferedInputStream.read(VisibleBufferedInputStream.java:73)
org.postgresql.core.PGStream.receiveChar(PGStream.java:443)
org.postgresql.core.v3.QueryExecutorImpl.processResults(QueryExecutorImpl.java:2069)
org.postgresql.core.v3.QueryExecutorImpl.execute(QueryExecutorImpl.java:322)
org.postgresql.jdbc.PgStatement.executeInternal(PgStatement.java:481)
org.postgresql.jdbc.PgStatement.execute(PgStatement.java:401)
org.postgresql.jdbc.PgPreparedStatement.executeWithFlags(PgPreparedStatement.java:164)
org.postgresql.jdbc.PgPreparedStatement.executeQuery(PgPreparedStatement.java:114)
org.apache.commons.dbcp2.DelegatingPreparedStatement.executeQuery(DelegatingPreparedStatement.java:83)
org.apache.commons.dbcp2.DelegatingPreparedStatement.executeQuery(DelegatingPreparedStatement.java:83)
com.atlassian.jira.ofbiz.sql.PreparedStatementWrapper.executeQuery(PreparedStatementWrapper.java:42)
com.atlassian.jira.diagnostic.connection.DiagnosticPreparedStatement.lambda$executeQuery$5(DiagnosticPreparedStatement.java:59)
com.atlassian.jira.diagnostic.connection.DiagnosticPreparedStatement$$Lambda$2896/0x00000017c3e35440.execute(Unknown Source)
com.atlassian.diagnostics.internal.platform.monitor.db.DefaultDatabaseDiagnosticsCollector.recordExecutionTime(DefaultDatabaseDiagnosticsCollector.java:70)
com.atlassian.jira.diagnostic.connection.DatabaseDiagnosticsCollectorDelegate.recordExecutionTime(DatabaseDiagnosticsCollectorDelegate.java:55)
com.atlassian.jira.diagnostic.connection.DiagnosticPreparedStatement.executeQuery(DiagnosticPreparedStatement.java:59)
org.ofbiz.core.entity.jdbc.SQLProcessor.executeQuery(SQLProcessor.java:527)
org.ofbiz.core.entity.GenericDAO.createEntityListIterator(GenericDAO.java:881)
org.ofbiz.core.entity.GenericDAO.selectListIteratorByCondition(GenericDAO.java:861)
org.ofbiz.core.entity.GenericDAO.selectByAnd(GenericDAO.java:733)
org.ofbiz.core.entity.GenericHelperDAO.findByAnd(GenericHelperDAO.java:166)
org.ofbiz.core.entity.GenericDelegator.findByAnd(GenericDelegator.java:913)
org.ofbiz.core.entity.GenericDelegator.findByAnd(GenericDelegator.java:891)
org.ofbiz.core.entity.GenericDelegator.findByAnd(GenericDelegator.java:860)
com.atlassian.jira.ofbiz.DefaultOfBizDelegator.findByAnd(DefaultOfBizDelegator.java:83)
com.atlassian.jira.ofbiz.WrappingOfBizDelegator.findByAnd(WrappingOfBizDelegator.java:62)
com.atlassian.jira.association.NodeAssociationStoreImpl.getAssociations(NodeAssociationStoreImpl.java:238)
com.atlassian.jira.association.NodeAssociationStoreImpl.getAssociationsFromSource(NodeAssociationStoreImpl.java:214)
com.atlassian.jira.association.NodeAssociationStoreImpl.getSinkIdsFromSource(NodeAssociationStoreImpl.java:178)
com.atlassian.jira.issue.index.indexers.impl.BaseFieldIndexer.indexDependentEntities(BaseFieldIndexer.java:223)
com.atlassian.jira.issue.index.indexers.impl.FixForVersionsIndexer.addIndex(FixForVersionsIndexer.java:23)
com.atlassian.jira.issue.index.indexers.FieldIndexer.addIndex(FieldIndexer.java:114)
com.atlassian.jira.issue.index.indexers.FieldIndexerWithStats.addIndex(FieldIndexerWithStats.java:58)
com.atlassian.jira.issue.index.DefaultIssueDocumentFactory$Builder.add(DefaultIssueDocumentFactory.java:323)
com.atlassian.jira.issue.index.DefaultIssueDocumentFactory$Builder.addAll(DefaultIssueDocumentFactory.java:299)
com.atlassian.jira.issue.index.DefaultIssueDocumentFactory.getDocument(DefaultIssueDocumentFactory.java:134)
com.atlassian.jira.issue.index.DefaultIssueDocumentFactory.lambda$createDocuments$1(DefaultIssueDocumentFactory.java:119)
com.atlassian.jira.issue.index.DefaultIssueDocumentFactory$$Lambda$3215/0x00000017c3fc7c40.accept(Unknown Source)
java.util.Collections$SingletonList.forEach(java.base@11.0.13/Unknown Source)
com.atlassian.jira.issue.index.DefaultIssueDocumentFactory.createDocuments(DefaultIssueDocumentFactory.java:118)
com.atlassian.jira.issue.index.DefaultIssueDocumentFactory.createDocument(DefaultIssueDocumentFactory.java:94)
com.atlassian.jira.issue.index.DefaultIssueIndexer$DefaultDocumentCreationStrategy.get(DefaultIssueIndexer.java:1310)
com.atlassian.jira.issue.index.DefaultIssueIndexer$IssuesOperation.createDocument(DefaultIssueIndexer.java:981)
com.atlassian.jira.issue.index.DefaultIssueIndexer$EntityOperation.perform(DefaultIssueIndexer.java:829)
com.atlassian.jira.issue.index.DefaultIssueIndexer.lambda$null$4(DefaultIssueIndexer.java:517)
com.atlassian.jira.issue.index.DefaultIssueIndexer$$Lambda$3084/0x00000017c3f63440.get(Unknown Source)
com.atlassian.jira.index.SimpleIndexingStrategy.apply(SimpleIndexingStrategy.java:7)
com.atlassian.jira.index.SimpleIndexingStrategy.apply(SimpleIndexingStrategy.java:5)
com.atlassian.jira.issue.index.DefaultIssueIndexer.lambda$perform$5(DefaultIssueIndexer.java:515)
com.atlassian.jira.issue.index.DefaultIssueIndexer$$Lambda$3079/0x00000017c3f64c40.consume(Unknown Source)
com.atlassian.jira.index.ha.NullAwareIssueIdsIssueIterable.foreach(NullAwareIssueIdsIssueIterable.java:27)
com.atlassian.jira.issue.index.DefaultIssueIndexer.perform(DefaultIssueIndexer.java:489)
com.atlassian.jira.issue.index.DefaultIssueIndexer.reindexIssues(DefaultIssueIndexer.java:352)
com.atlassian.jira.issue.index.DefaultIndexManager.lambda$reIndexIssues$5(DefaultIndexManager.java:661)
com.atlassian.jira.issue.index.DefaultIndexManager$$Lambda$3078/0x00000017c3f64840.get(Unknown Source)
com.atlassian.jira.issue.index.DefaultIndexManager.executeWithIndexLock(DefaultIndexManager.java:919)
com.atlassian.jira.issue.index.DefaultIndexManager.reIndexIssues(DefaultIndexManager.java:661)
jdk.internal.reflect.NativeMethodAccessorImpl.invoke0(java.base@11.0.13/Native Method)
jdk.internal.reflect.NativeMethodAccessorImpl.invoke(java.base@11.0.13/Unknown Source)
jdk.internal.reflect.DelegatingMethodAccessorImpl.invoke(java.base@11.0.13/Unknown Source)
java.lang.reflect.Method.invoke(java.base@11.0.13/Unknown Source)
com.atlassian.jira.config.component.SwitchingInvocationHandler.invoke(SwitchingInvocationHandler.java:38)
com.sun.proxy.$Proxy39.reIndexIssues(Unknown Source)
com.atlassian.jira.index.ha.DefaultIndexRecoveryManager.reindexIssueByIds(DefaultIndexRecoveryManager.java:345)
com.atlassian.jira.index.ha.DefaultIndexRecoveryManager.reindexOutdatedEntities(DefaultIndexRecoveryManager.java:326)
com.atlassian.jira.index.ha.DefaultIndexRecoveryManager.reindexWithVersionCheckEntitiesUpdatedInTheLast(DefaultIndexRecoveryManager.java:266)
com.atlassian.jira.index.ha.DefaultIndexRecoveryManager.reindexWithVersionCheckEntitiesUpdatedInTheLast(DefaultIndexRecoveryManager.java:225)
com.atlassian.jira.index.ha.DefaultIndexRecoveryManager.recoverIndexFromBackup(DefaultIndexRecoveryManager.java:185)
com.atlassian.jira.index.DefaultIndexFetcher.recoverIndexFromMostRecentSnapshot(DefaultIndexFetcher.java:109)
The three key giveaways here are:
Thread name: localhost-startStop-1 - which means that the node is in 'starting' state
The thread state - RUNNABLE, means it's not unresponsive
The stack trace references "com.atlassian.jira.index.ha.DefaultIndexRecoveryManager" which means that the Node is undergoing through index recovery process (see details below)
Step 3 (optional) but to be on the safe side:
Navigate to the local indexing folder on the node, usually it's $JIRA_HOME/caches/IndexesV1 and pick one of the folders, for example 'Issues'. List the content of the folder with 'ls -lah' command (or DIR on Windows) redirecting the output for example to ls1.txt (ls -lah $JIRA_HOME/caches/IndexesV1/issues > ls1.txt), then wait for some time (maybe a minute), then repeat the command but this time redirect the output to ls2.txt. Once both files have been generated, perform a comparison (diff in Linux, or fc in Windows).
If you see that the content of the folders changed, that means that JIRA is simply starting up and no action required.
Cause
If you are undergoing one of the above listed scenarios (under the Environment section) and it takes a while for a node to startup, the slowness is actually not abnormal (i.e. it is an expected behaviour) and it is not unusual for a newly added node to take a while to start up (Performance is relative, in some cases on certain Jira version it could take hours for a cluster node to startup, while other customers on the same version, smaller data set and different environment could take 3 minutes; As an example - 1 hour for starting a new node in a Jira Data Center cluster with 11 million of issues is not unusual) as the node needs to retrieve the up to date indexes from either $SHARED_HOME folder, or directly from a working node in the cluster.
High level overview, a new node first needs to transfer the indexing snapshot file over the network (if the the snapshot exists), then it needs to extract it on the node, and then the node needs to catch up with the rest of the nodes by updating the indexes directly from the database.
There are potentially edge cases where multiple nodes are starting up at the same time, which could result in a 'race' condition whereby by a last started node would be requesting an index snapshot from a node that also just started and needs to recover its indexes in the first place, this could aggravate the slowness as well
Solution
If you are undergoing through one of the above listed scenarios, the solution is to simply wait for a reasonable amount of time for the node to complete it's startup sequence. If the node still doesn't start up, please review the above linked articles under the cause and contact Atlassian Support for assistance.
ℹ️ For upgrades, please also avoid starting all nodes at the same time, ideally start one node, wait for it to start and join the cluster, then proceed with the next node until the cluster is fully upgraded.
Further details on potential bugs and documentation that could be contributing to the slowness:
JRASERVER-74298 - Jira node fails to start due to cluster lock at the active objects
JRASERVER-74232 - Make index catch up during startup multi-threaded
Reference Kbs:
Was this helpful?