How do connection pool parameters affect the Y-axis parameter range in a database monitoring graph
Platform Notice: Data Center Only - This article only applies to Atlassian apps on the Data Center platform.
Note that this KB was created for the Data Center version of the product. Data Center KBs for non-Data-Center-specific features may also work for Server versions of the product, however they have not been tested. Support for Server* products ended on February 15th 2024. If you are running a Server product, you can visit the Atlassian Server end of support announcement to review your migration options.
*Except Fisheye and Crucible
Summary
This knowledge base article provides a detailed explanation of the database connection graph located in Jira Administration → Systems → Database monitoring. It explains the correlation between adjustments made to the DB pool size in dbconfig.xml and the resulting impact on the Y-axis range illustrated in the database monitoring graphs.
Environment
Jira Data Center
Solution
The Database monitoring graph represents data derived from particular Database parameters outlined in the $JIRA_HOME/dbconfig.xml file. A clear comprehension of these parameters is essential for accurately interpreting the graph. In database configuration, the following three parameters play a critical role in displaying the database monitoring graph:
<pool-min-size>20</pool-min-size>
<pool-max-size>20</pool-max-size>
<pool-max-idle>20</pool-max-idle>
There are different ways to update the above parameters, and accordingly, the database monitoring graph will represent the statistics.
Scenario 1:
If the value of pool-min-size is lower than the pool-max-idle value, illustrated below, the graph will display the default pool-min-size thresholdvalue on the Y-axis.
<pool-min-size>30</pool-min-size>
<pool-max-size>70</pool-max-size>
<pool-max-idle>50</pool-max-idle>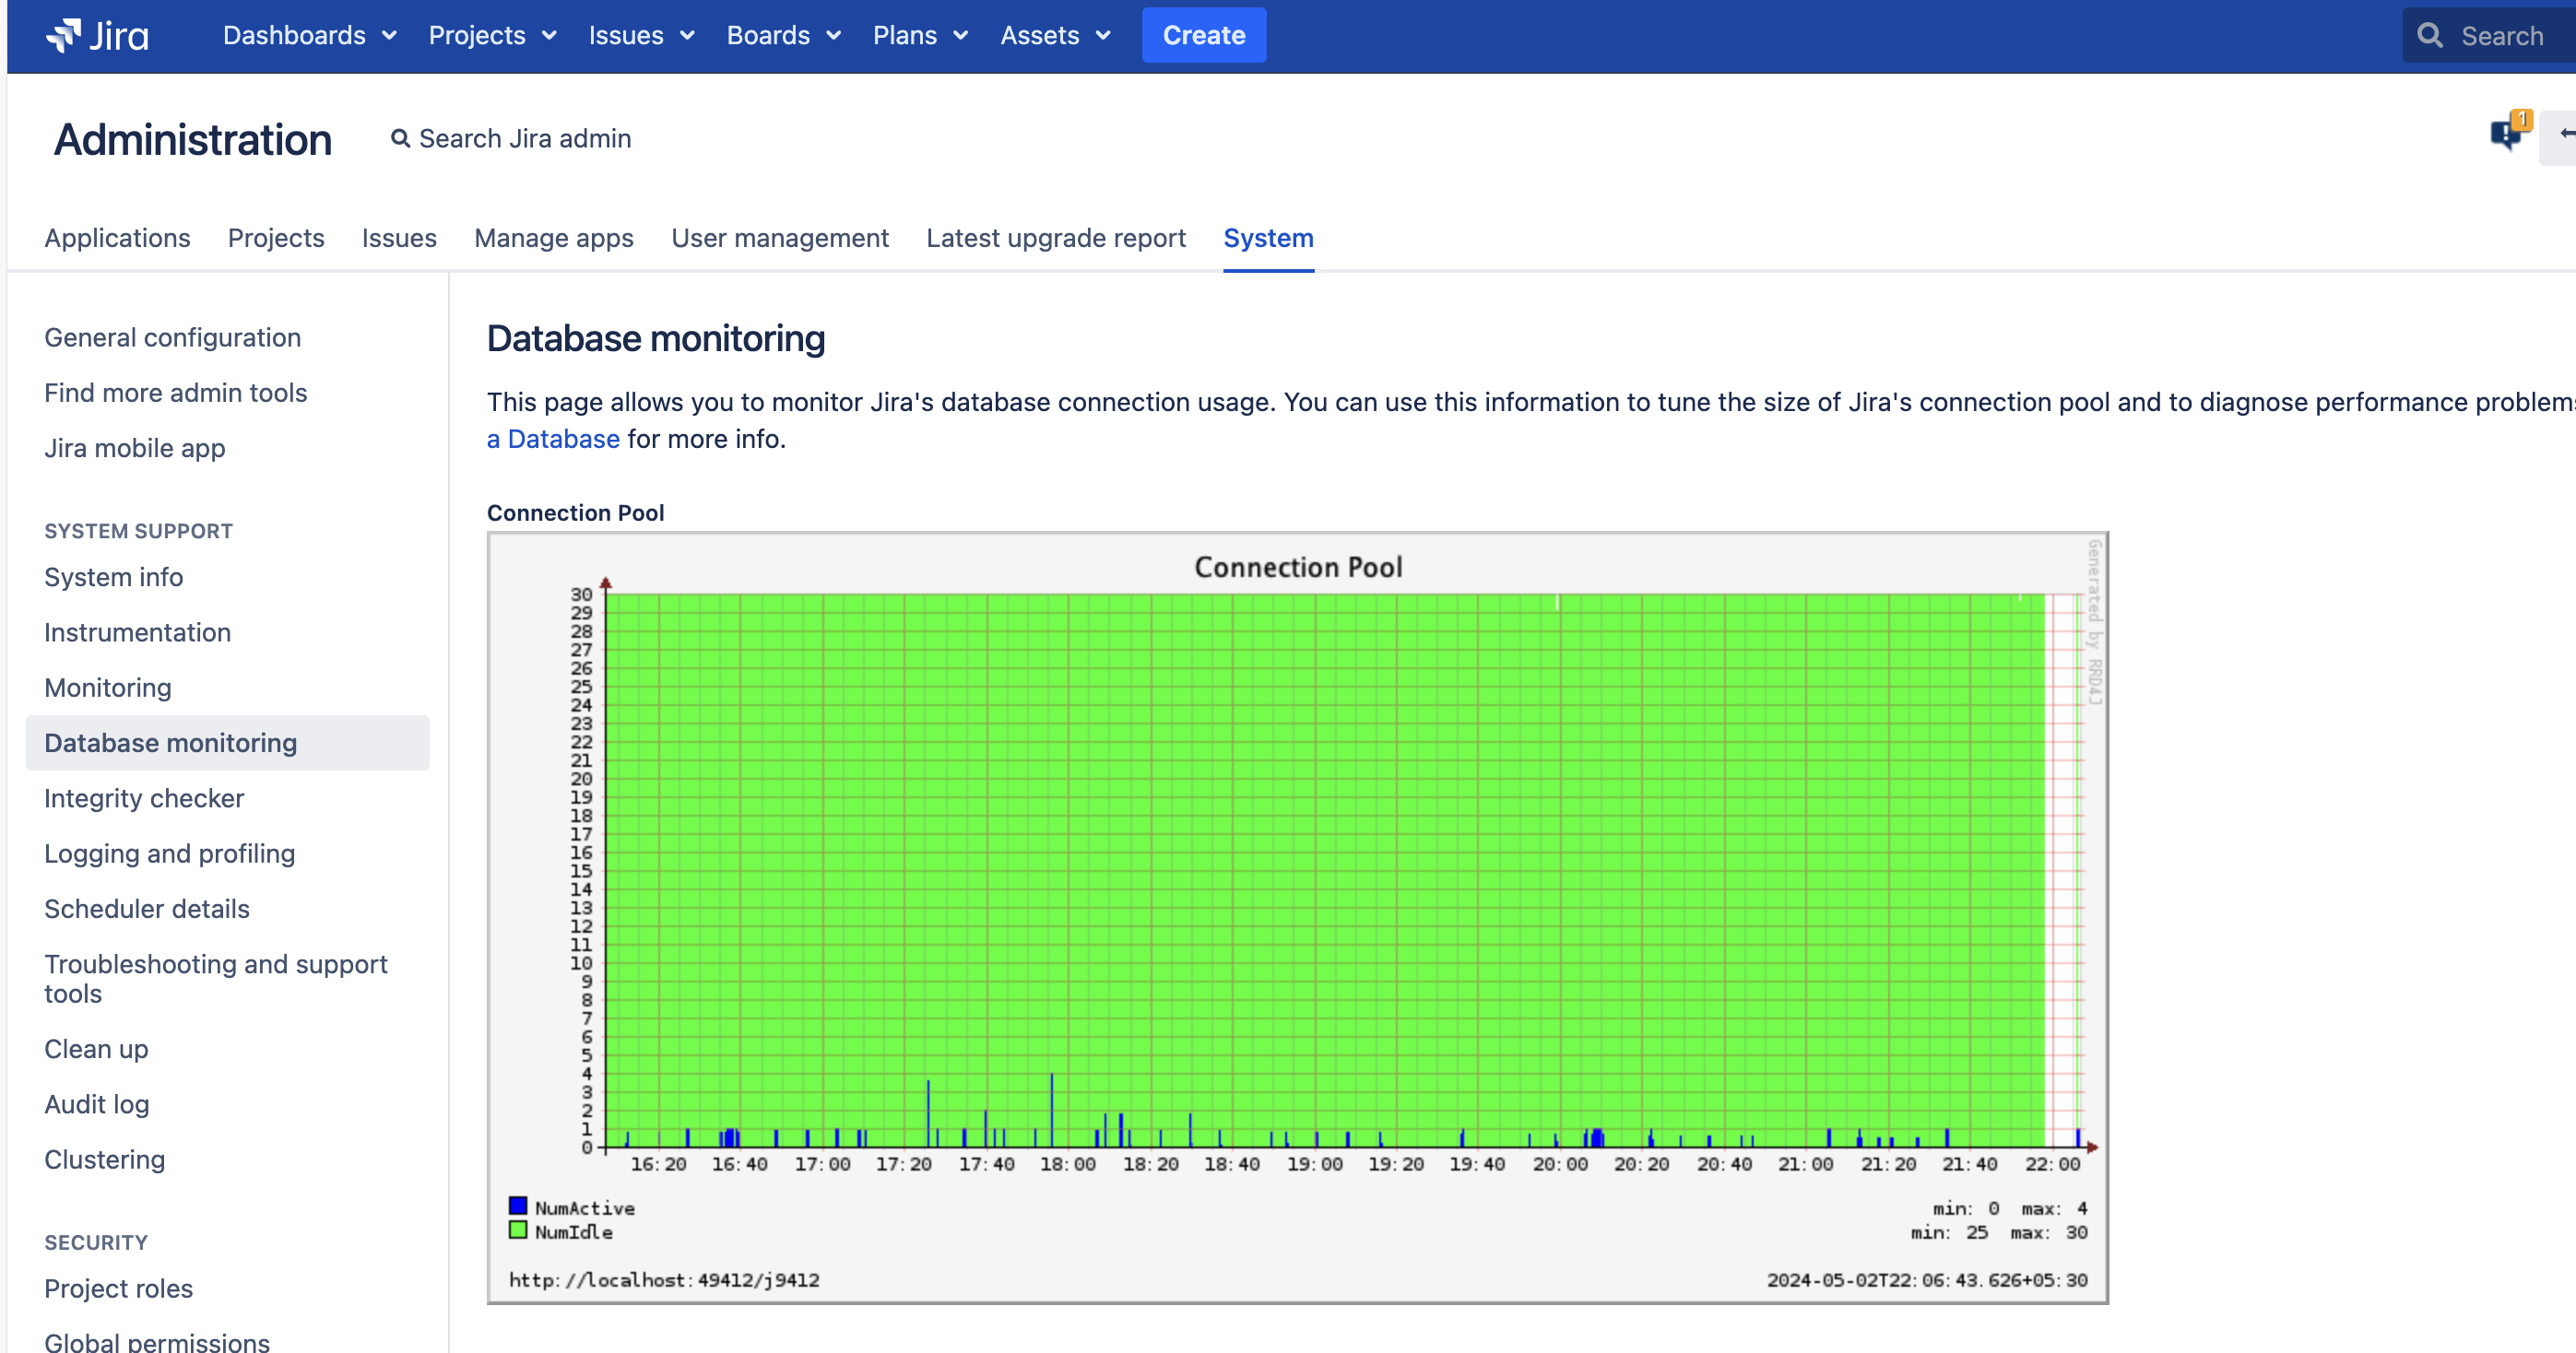
Scenario 2:
If the pool-min-size value surpasses the pool-max-idle value, as shown below, the graph will promptly exhibit the default pool-max-idle threshold value on the Y-axis.
<pool-min-size>30</pool-min-size>
<pool-max-size>70</pool-max-size>
<pool-max-idle>20</pool-max-idle>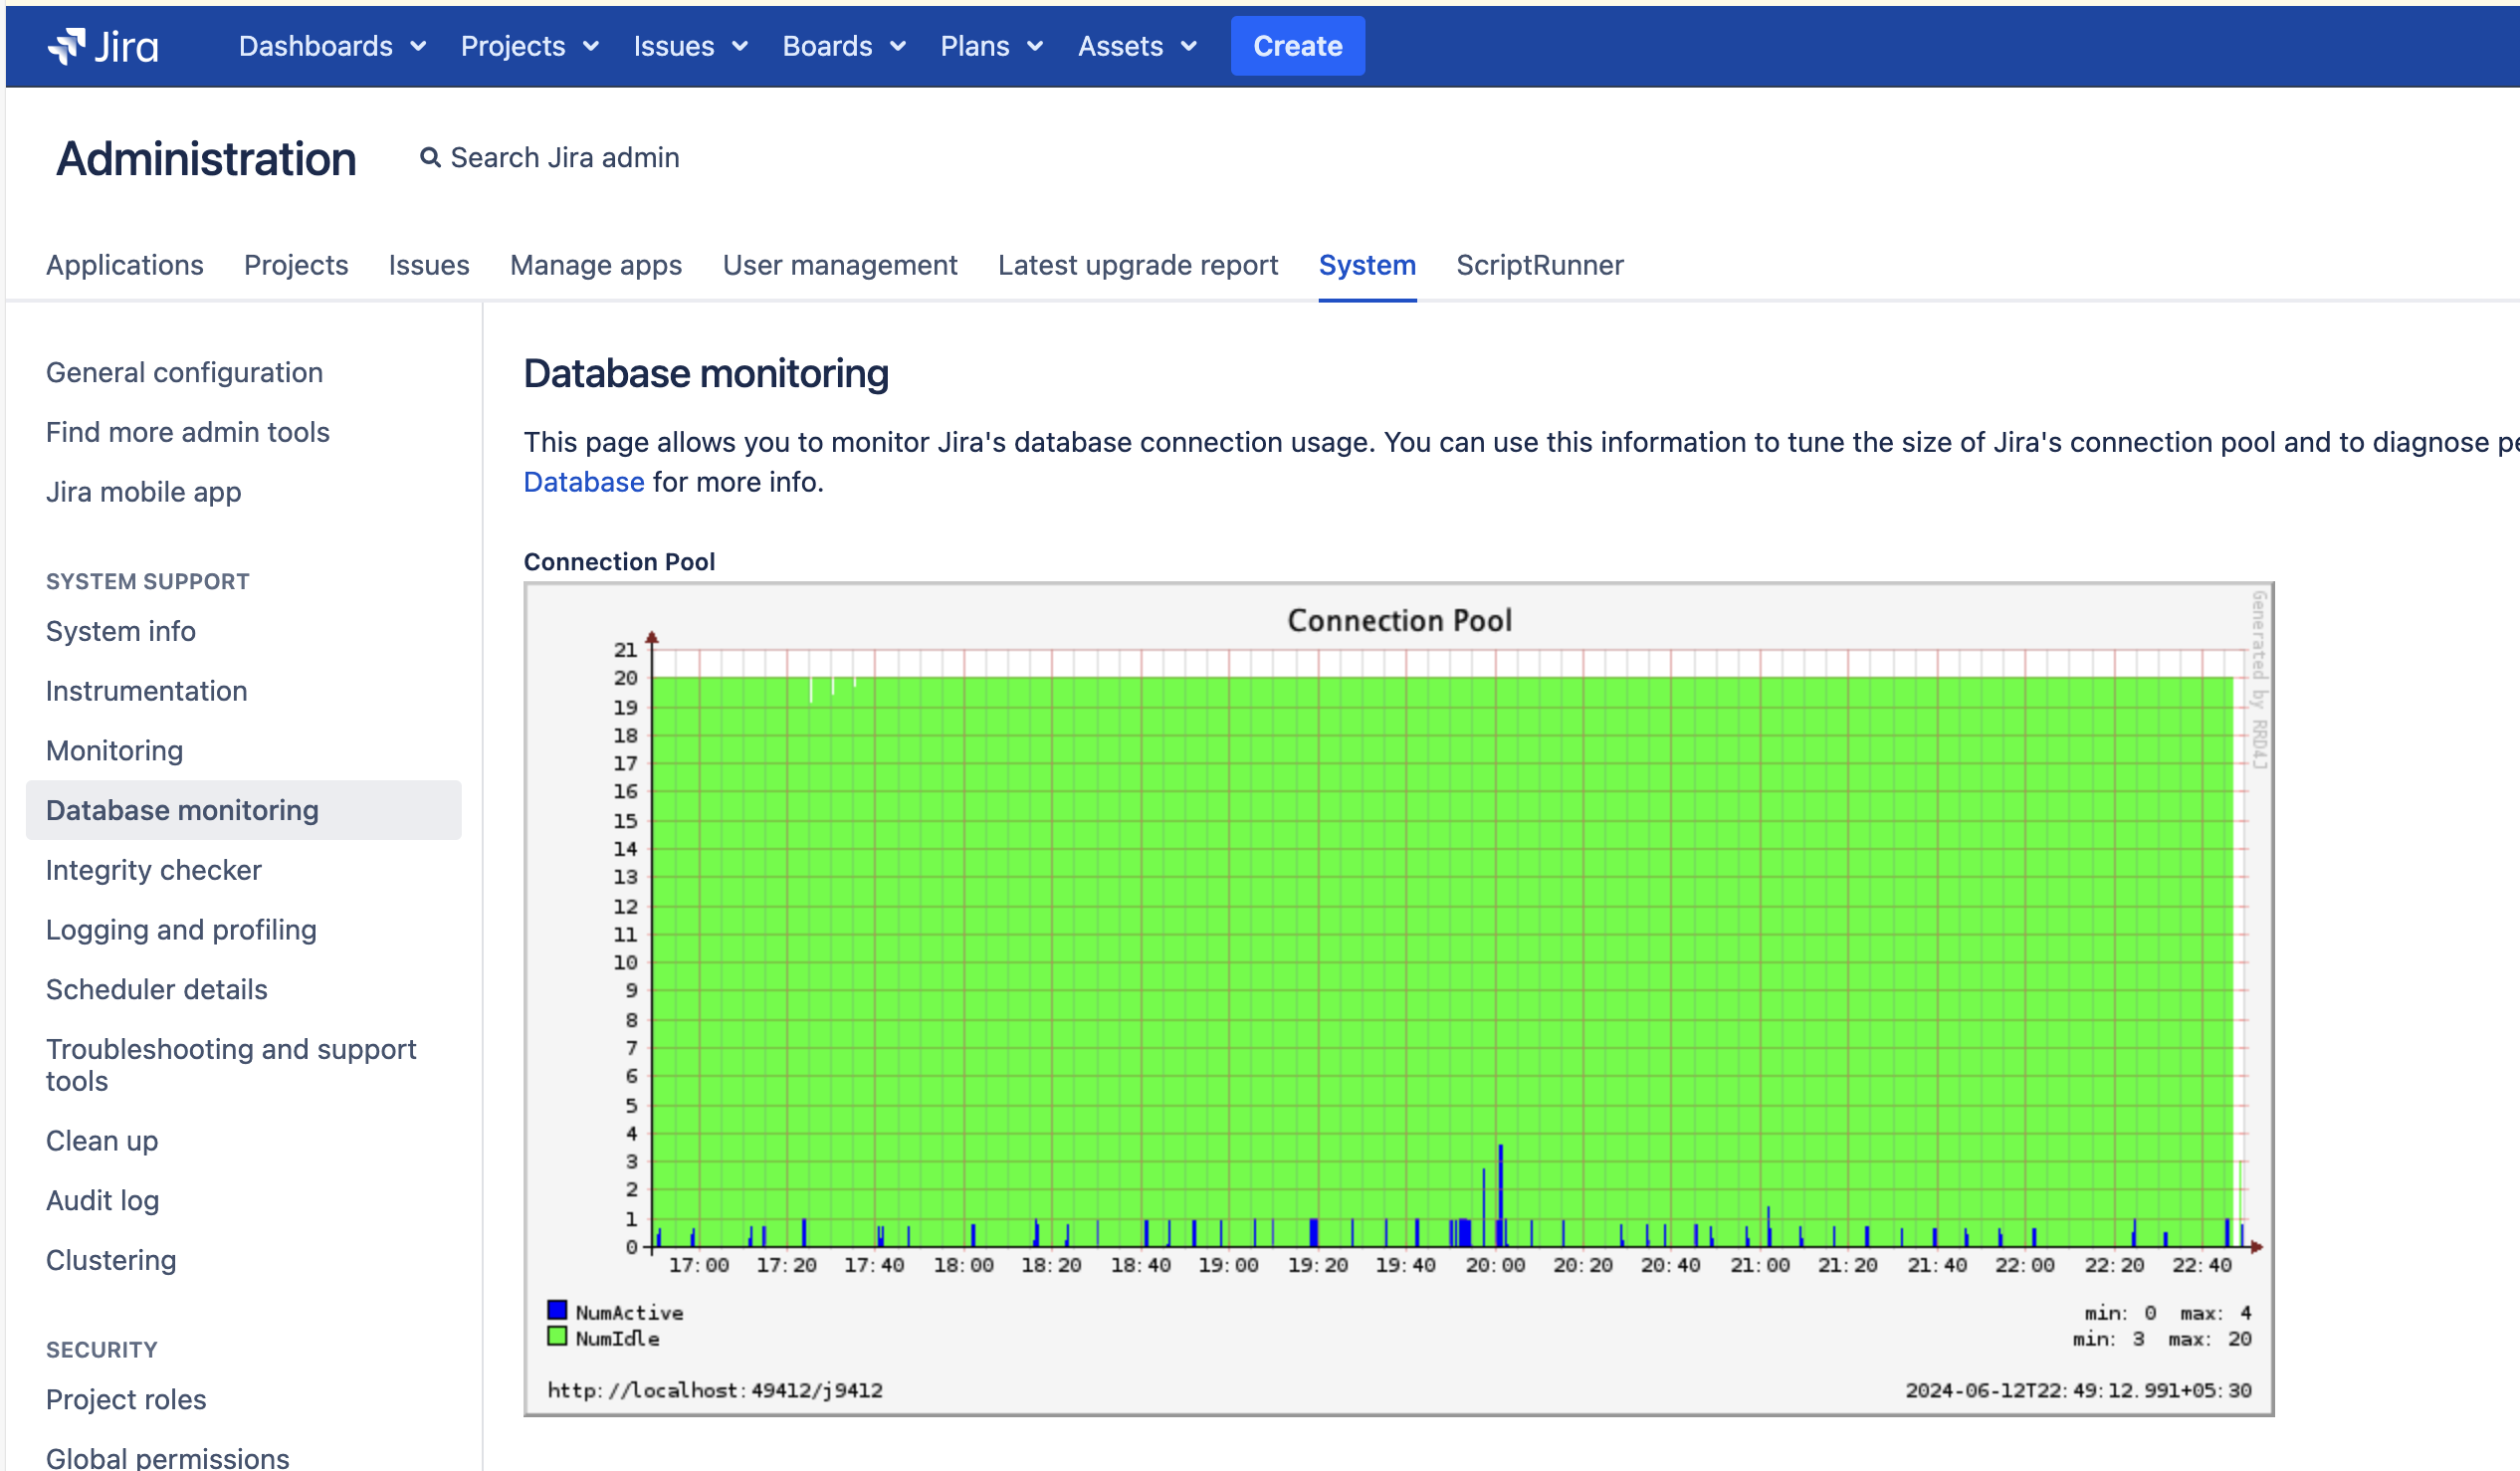
Was this helpful?