Health Check: Webhooks
Platform Notice: Data Center Only - This article only applies to Atlassian apps on the Data Center platform.
Note that this KB was created for the Data Center version of the product. Data Center KBs for non-Data-Center-specific features may also work for Server versions of the product, however they have not been tested. Support for Server* products ended on February 15th 2024. If you are running a Server product, you can visit the Atlassian Server end of support announcement to review your migration options.
*Except Fisheye and Crucible
Summary
About the health checks
These webhook-related health checks were introduced in Jira Data Center 10.3.19.
There are six webhook-related health checks that verify webhook performance and reliability. Most of these checks rely on Webhook STATS being enabled. If Webhook STATS are disabled, the corresponding health checks will not be available. See Webhook Stats | Jira and Jira Service Management | Atlassian Support for Webhook STATS details.
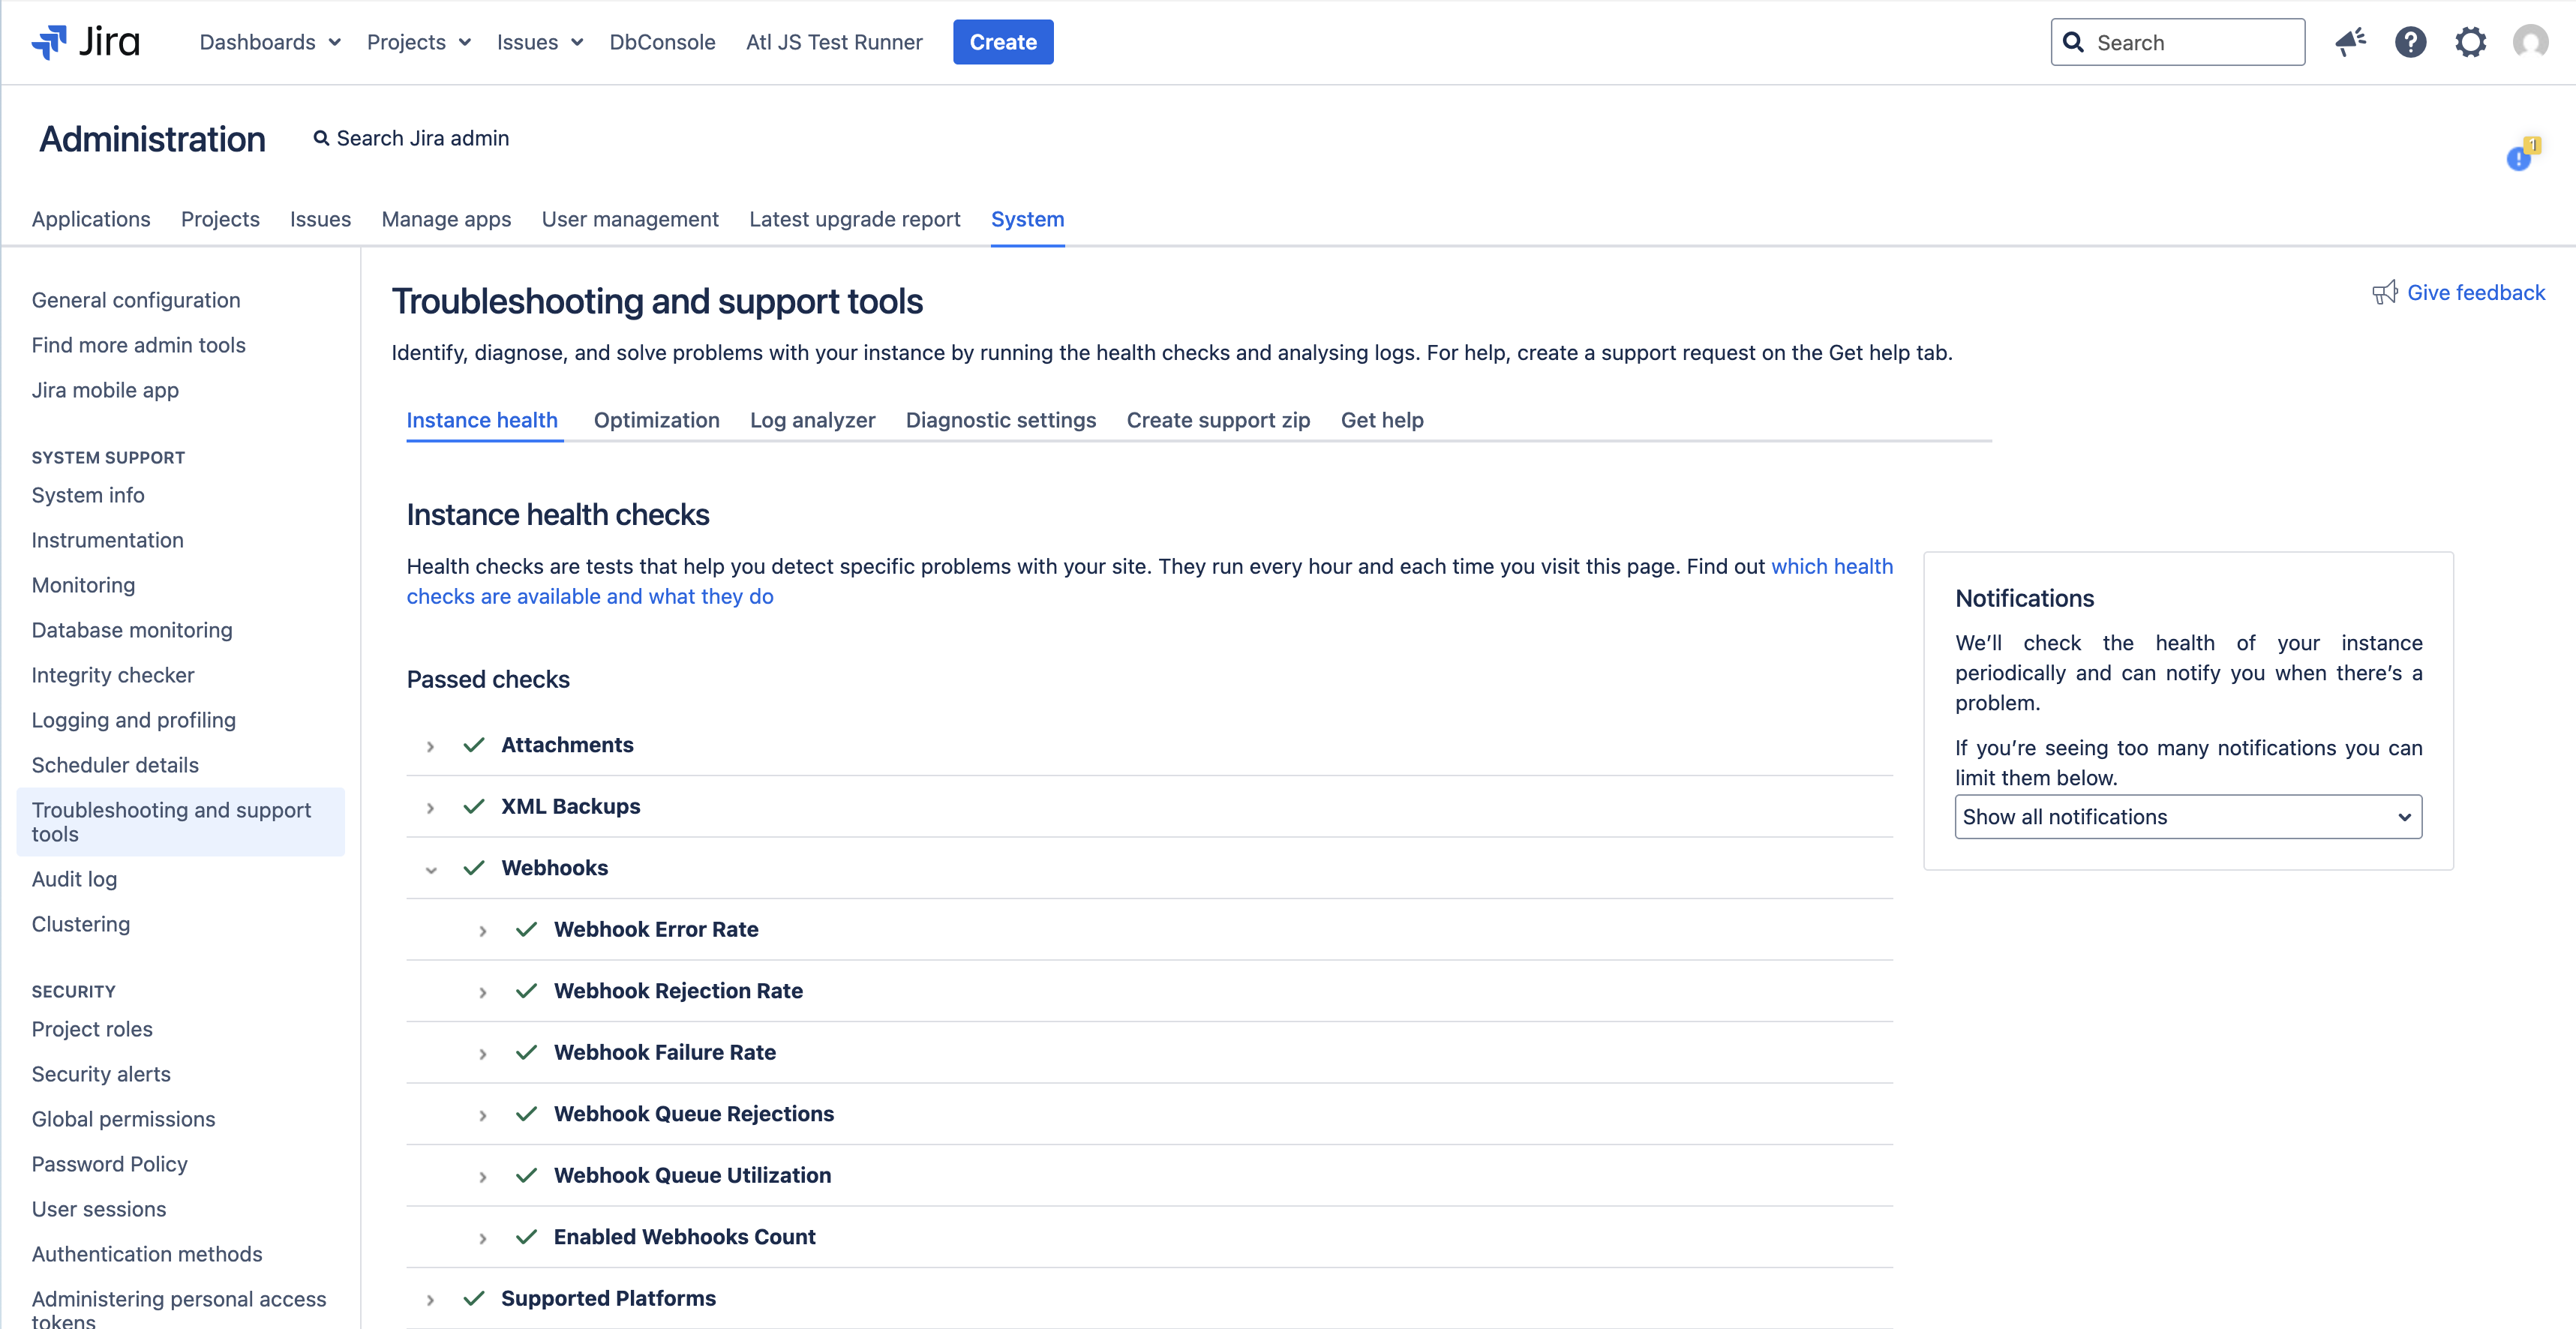
All webhook health checks are available under the Instance health section of Troubleshooting and support tools in Jira administration, where they appear as standard health check entries (see screenshot below).
Learn more about health checks in the Jira Data Center health check tools documentation: Jira Data Center Health Check Tools | Enterprise Data Center Latest | Atlassian Documentation.
In this page:
a webhook invocation refers to a single attempt by Jira to deliver a webhook event to a target endpoint
the health check time window refers to the period covered by the recent statistics snapshots used by these health checks (by default, one hour - see the Webhook health checks configuration section below for details).
For details on each webhook health check and recommended actions for Warning or Critical status, see the Webhook health checks table below.
For default thresholds and configuration properties, see the Webhook health checks configuration table below.
Solution
Webhook health checks
Health check | Description | When this check is Warning or Critical: |
|---|---|---|
Failure Rate | Webhook invocation is considered to have failed when Jira is unable to successfully deliver the webhook to the target endpoint. This typically happens when the receiver responds with a non‑2xx HTTP status code (for example, 4xx or 5xx), or when delivery cannot be completed due to network issues. The Failure Rate health check analyzes the ratio of failed webhook invocations to total webhook invocations over the health check time window and raises an alert when this ratio crosses the configured thresholds. | Investigate any potential errors with the integration. Check how to get more details from logs Troubleshooting webhooks in Jira Data Center | Jira and Jira Service Management | Atlassian Support. |
Error Rate | Webhook invocation is considered to have finished with an error when an exception is thrown during its execution. This can be caused by network-related issues or other unexpected errors. The Error Rate health check analyzes the ratio of errored webhook invocations to total webhook invocations over the health check time window and raises an alert when this ratio crosses the configured thresholds. | Investigate any potential errors with the integration or network. Check how to get more details from logs Troubleshooting webhooks in Jira Data Center | Jira and Jira Service Management | Atlassian Support. |
Rejection Rate | A webhook invocation is considered rejected when Jira cannot accept it for processing and drops it before delivery. This may happen due to limits or safety mechanisms, such as rate limiting or capacity protection, that prevent Jira from enqueueing or sending additional webhooks. The Rejection Rate health check analyzes the ratio of rejected webhook invocations to total webhook invocations over the health check time window and raises an alert when this ratio crosses the configured thresholds. | Consider tuning webhook performance parameters as stated in Tuning webhook performance parameters in Jira Data Center | Jira and Jira Service Management | Atlassian Support. |
Queue Rejections | The Queue Rejections health check monitors webhook invocations that cannot be accepted into Jira’s internal queues and are rejected instead of being processed. Webhook invocations are handled by two internal queues: Processing queue – holds webhook tasks before they are processed. HTTP dispatch (in-flight) queue – holds webhook calls that have been successfully processed by the processing queue and are about to be sent to external endpoints. This health check analyzes webhook queue rejections across both queues and evaluates status based on the following rules: Warning – there are no queue rejections in a current time window, but there has been at least one queue rejection in total since this Jira node started (from either the processing queue or the HTTP dispatch queue). Critical – there are queue rejections from any queue (processing queue or HTTP dispatch queue) within the health check time window. Because any rejection is considered abnormal, the effective thresholds are: Warning threshold: Critical threshold: | Consider tuning webhook performance parameters as stated in Tuning webhook performance parameters in Jira Data Center | Jira and Jira Service Management | Atlassian Support. |
Queue Usage | The Queue Usage health check monitors how full the webhook processing queue is and alerts when utilization approaches or reaches capacity. This check analyzes webhook queue usage based on periodic statistics snapshots and evaluates the peak queue utilization over a health check time window. The length of the health check time window is derived from the configured number of snapshots and the interval between them. See Webhook health checks configuration section below for details. For this health check, queue capacity is defined as the combined capacity of both internal webhook queues (processing queue capacity + HTTP dispatch queue capacity). Peak queue usage is evaluated against this total combined capacity. | Consider tuning webhook performance parameters as stated in Tuning webhook performance parameters in Jira Data Center | Jira and Jira Service Management | Atlassian Support. |
Enabled Webhooks Count | The Enabled Webhooks Count health check monitors how many webhooks are currently enabled in the system and warns when this number approaches Jira’s internal limit for querying webhooks. For performance reasons, Jira applies a limit when querying enabled webhooks. By default, only the first 250 enabled webhooks are considered. If the number of enabled webhooks grows beyond this limit, Jira will deliver events only to the first 250 webhooks returned by the query, and additional enabled webhooks may not receive events. This health check analyzes the total count of enabled webhooks and raises an alert when the count approaches the configured limit. Use it to detect when your instance is getting close to the point where some enabled webhooks might stop receiving events. | Consider tuning webhook performance parameters as stated in Tuning webhook performance parameters in Jira Data Center | Jira and Jira Service Management | Atlassian Support. |
Webhook health checks configuration
The table below summarizes each webhook-related health check, its configuration properties, default values, and descriptions.
Health check | What it measures | Configurable properties | Default value | Description |
|---|---|---|---|---|
Failure Rate | Overall failures to deliver webhooks (e.g., non-2xx) | webhooks.healthcheck.failureRate.threshold.warning | 0.05 | Warning is triggered when failures are equal to or greater than 5% of total webhook invocations in the health check time window. |
webhooks.healthcheck.failureRate.threshold.critical | 0.10 | Critical is triggered when failures are equal to or greater than 10% of total webhook invocations in the health check time window. | ||
webhooks.healthcheck.failureRate.threshold.minimalRequestsCountInSnapshots | 100 | Requires at least 100 requests in the time window; otherwise, reports “not enough data.” | ||
Error Rate | Ratio of webhook invocations ending with an exception | webhooks.healthcheck.errorRate.threshold.warning | 0.05 | Warning is triggered when errors are equal to or greater than 5% of total webhook invocations in the health check time window. |
webhooks.healthcheck.errorRate.threshold.critical | 0.10 | Critical is triggered when errors are equal to or greater than 10% of total webhook invocations in the health check time window. | ||
webhooks.healthcheck.errorRate.threshold.minimalRequestsCountInSnapshots | 100 | Requires at least 100 requests in the time window; otherwise, reports “not enough data.” | ||
Rejection Rate | Requests rejected by rate limits or capacity | webhooks.healthcheck.rejectionRate.threshold.warning | 0.05 | Warning is triggered when rejections are equal to or greater than 5% of total webhook invocations in the health check time window. |
webhooks.healthcheck.rejectionRate.threshold.critical | 0.10 | Critical is triggered when rejections are equal to or greater than 10% of total webhook invocations in the health check time window. | ||
webhooks.healthcheck.rejectionRate.threshold.minimalRequestsCountInSnapshots | 100 | Requires at least 100 requests in the time window; otherwise, reports “not enough data.” | ||
Queue Rejections | Webhook tasks dropped by internal queues | webhooks.healthcheck.queueRejections.threshold.warning | 0 | Any queue rejections observed since this Jira node started (total rejections > 0) trigger a warning. |
webhooks.healthcheck.queueRejections.threshold.critical | 0 | Any queue rejections observed in the health check time window (recent rejections > 0) trigger a critical status. | ||
Queue Usage | Utilization of webhook processing queues | webhooks.healthcheck.queueUsage.threshold.warning | 0.7 | Warning is triggered when the peak webhook queue usage in the health check time window is greater than or equal to 0.7 (70%) of queue capacity. |
webhooks.healthcheck.queueUsage.threshold.critical | 0.9 | Critical is triggered when the peak webhook queue usage in the health check time window is greater than or equal to 0.9 (90%) of queue capacity. | ||
webhooks.healthcheck.queueUsage.threshold.minimalSnapshotCount | 2 | At least 2 statistics snapshots must be available; otherwise, the health check reports “not enough data.” | ||
Enabled Webhooks Count | Number of enabled webhooks in the instance | webhooks.healthcheck.enabledWebhooksCount.threshold.warning | 0.9 | Warning is triggered when the number of enabled webhooks is greater than or equal to 0.9 (90%) of the configured limit used when querying webhooks. |
webhooks.healthcheck.enabledWebhooksCount.threshold.critical | 0.95 | Critical is triggered when the number of enabled webhooks is greater than or equal to 0.95 (95%) of the configured limit used when querying webhooks. |
Most of the webhook-related health checks use recent webhook statistics snapshots when computing their status. The number of snapshots that are taken into account is controlled by the following property:
webhooks.healthcheck.statistics.queue.size– defines how many recent statistics snapshots are used when analyzing health check statuses. The default value is12. The default snapshot time interval is 5 minutes (see Webhook Stats | Jira and Jira Service Management | Atlassian Support), so in the default configuration, the health check time window (covered by these statistics) is one hour.
A larger value increases the time window that health checks consider (smoothing out short spikes), while a smaller value makes them react more quickly to recent changes.
Add these properties to the jira-config.properties file to override the defaults. For details, see Advanced Jira application configuration.
Was this helpful?