GC log results are not rendering correctly in log viewer tool such as GCviewer
Platform Notice: Data Center Only - This article only applies to Atlassian apps on the Data Center platform.
Note that this KB was created for the Data Center version of the product. Data Center KBs for non-Data-Center-specific features may also work for Server versions of the product, however they have not been tested. Support for Server* products ended on February 15th 2024. If you are running a Server product, you can visit the Atlassian Server end of support announcement to review your migration options.
*Except Fisheye and Crucible
Summary
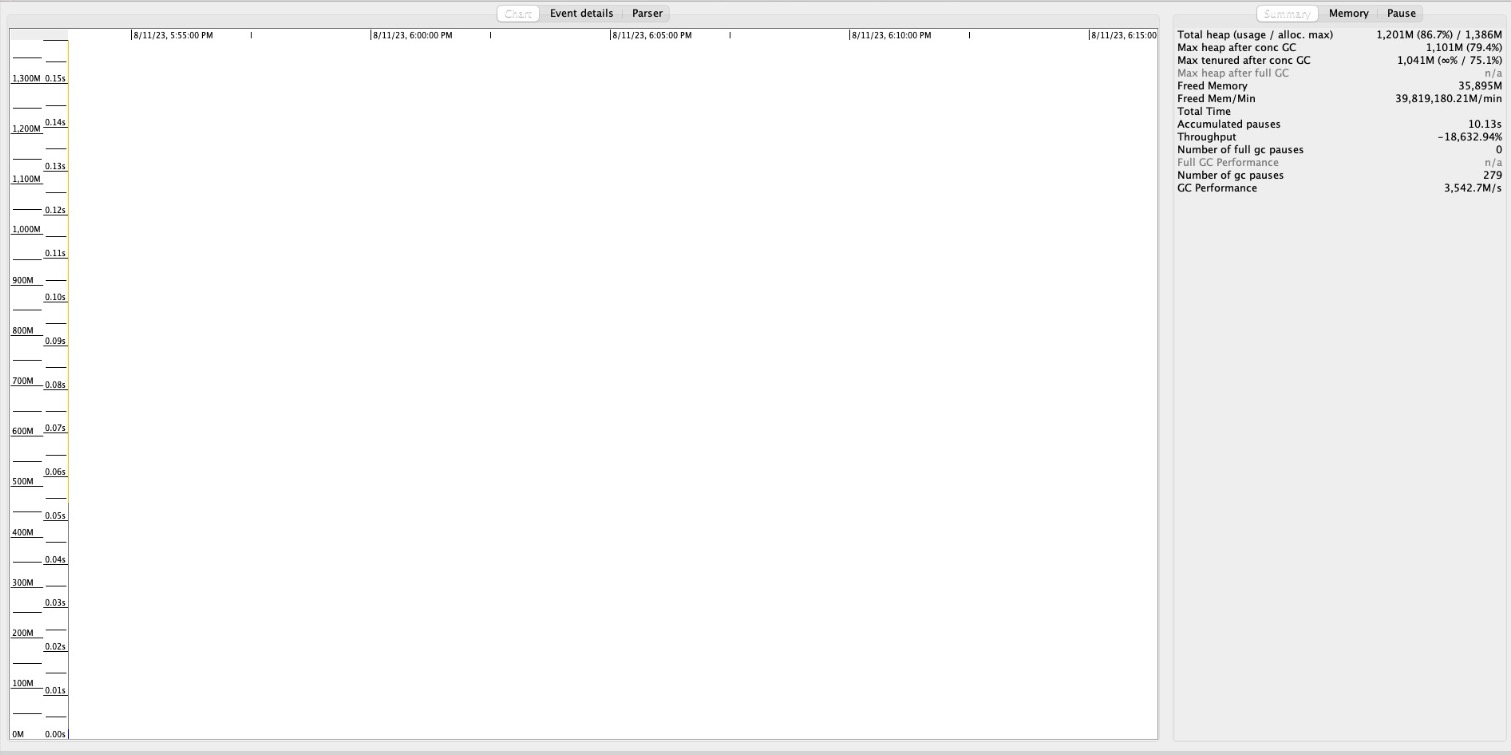
GC logs are not being read by the GCviewer tool. After importing an atlassian-jira-gc log file into GC viewer the chart is not rendering as expected as shown below
Environment
Any Jira Server/Data Center version.
Diagnosis
When opening the raw data of an affected GClog file it is likely that you will find event data but you will notice there aren't any date/time stamps or duration data points.
[info][gc,cpu        ] GC(9057) User=0.07s Sys=0.00s Real=0.04s
[info][gc,start      ] GC(9058) Pause Young (Normal) (G1 Evacuation Pause)
[info][gc,task       ] GC(9058) Using 2 workers of 2 for evacuation
[info][gc,phases     ] GC(9058)   Pre Evacuate Collection Set: 0.1ms
[info][gc,phases     ] GC(9058)   Evacuate Collection Set: 36.9ms
[info][gc,phases     ] GC(9058)   Post Evacuate Collection Set: 3.1ms
[info][gc,phases     ] GC(9058)   Other: 0.6ms
[info][gc,heap       ] GC(9058) Eden regions: 421->0(419)
[info][gc,heap       ] GC(9058) Survivor regions: 16->17(55)
[info][gc,heap       ] GC(9058) Old regions: 823->823
[info][gc,heap       ] GC(9058) Humongous regions: 20->20
[info][gc,metaspace  ] GC(9058) Metaspace: 584092K->584092K(1585152K)
[info][gc            ] GC(9058) Pause Young (Normal) (G1 Evacuation Pause) 1279M->859M(1441M) 40.727ms
[info][gc,cpu        ] GC(9058) User=0.08s Sys=0.00s Real=0.04s
The expected log data should look similar to the below example
[2023-08-10T16:38:12.730-0700][107477.523s][info][gc,phases     ] GC(3854)   Other: 0.4ms
[2023-08-10T16:38:12.730-0700][107477.523s][info][gc,heap       ] GC(3854) Eden regions: 328->0(331)
[2023-08-10T16:38:12.730-0700][107477.523s][info][gc,heap       ] GC(3854) Survivor regions: 5->4(42)
[2023-08-10T16:38:12.730-0700][107477.523s][info][gc,heap       ] GC(3854) Old regions: 826->826
[2023-08-10T16:38:12.730-0700][107477.523s][info][gc,heap       ] GC(3854) Humongous regions: 20->20
[2023-08-10T16:38:12.730-0700][107477.523s][info][gc,metaspace  ] GC(3854) Metaspace: 574084K->574084K(1574912K)
[2023-08-10T16:38:12.731-0700][107477.523s][info][gc            ] GC(3854) Pause Young (Normal) (G1 Evacuation Pause) 1178M->849M(1327M) 22.174ms
[2023-08-10T16:38:12.731-0700][107477.523s][info][gc,cpu        ] GC(3854) User=0.04s Sys=0.00s Real=0.02s
When the time stamps and duration data are not included in the log events the log viewer is unable to chart this data.
⚠️ Please ensure that you are using one of the newer versions of GC Viewer. It may still not work in old versions.
Cause
This behavior is caused by missing tags in the set-gc-params.sh, set-gc-params.bat, or set-gc-params-service.bat file depending on what OS is being used to run Jira and if it is being run as a service in a Windows environment. The configuration item in question is for where GC log data is written to and what data points are added.
Default configuration for GC log data and format;
GC_JVM_PARAMETERS="-Xlog:gc*:file=/opt/atlassian/jira/logs/atlassian-jira-gc-%t.log:tags,time,uptime,level:filecount=5,filesize=20M"time - adds the date/time stamp
uptime - adds the duration of the event
Solution
Restore the above JVM argument back to the default configuration where the "time" and "uptime" tags are included.
Restart Jira
Please note that these changes will only be reflected in future GC log events. For log events that occurred prior to the configuration change, unfortunately, they will not be readable in GClogviewer
Was this helpful?