Garbled gibberish text rendered in browser when loading Jira
Platform Notice: Data Center Only - This article only applies to Atlassian apps on the Data Center platform.
Note that this KB was created for the Data Center version of the product. Data Center KBs for non-Data-Center-specific features may also work for Server versions of the product, however they have not been tested. Support for Server* products ended on February 15th 2024. If you are running a Server product, you can visit the Atlassian Server end of support announcement to review your migration options.
*Except Fisheye and Crucible
Summary
Problem
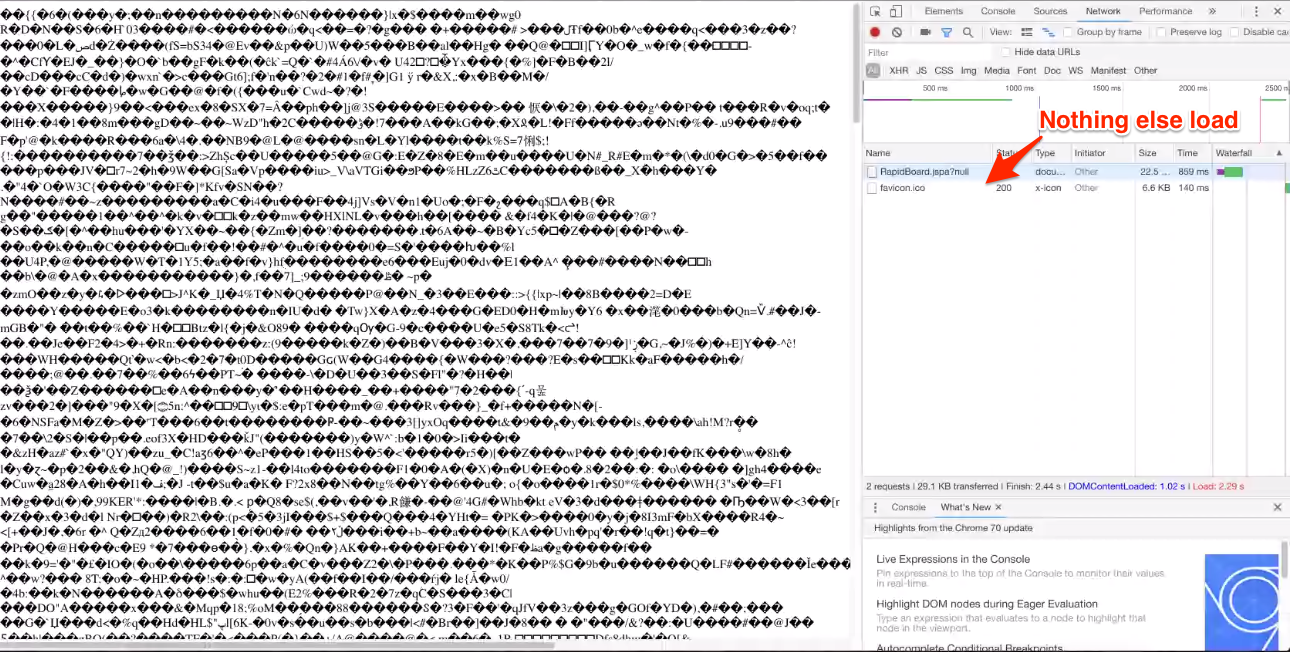
Loading Jira will have the page rendered to users as garbled, gibberish, unreadable text. No errors are thrown in the log, in fact, Jira is seen to be startup and working correctly.
Example of the page rendered by Jira:
Diagnosis
Diagnostic Steps
Performing
curlorwgetto Jira's dashboard or Jira's REST API returns the correct and readable informationGoing to $Jira_BASE_URL/plugins/servlet/mobile#myjirahome to render to Jira Mobile View works
The GZIP Compression in Jira is enabled, can be checked in
atlassian-jira.logby searching for jira.option.web.usegzipMonitoring tools agent is setup integrated with Jira application. This can be checked in
atlassian-jira.logby searching for agentpath setting in JVM parameters
Cause
Dynatrace agent script injected to Jira is the cause of the problem. This is due to the Dynatrace XHR monitoring setting is enabled in Dynatrace end.
The following traces are present in Chrome Development Tools's Console log once GZIP compression is disabled in Jira (done through the database):
Uncaught RangeError: Maximum call stack size exceeded
    at String.indexOf (<anonymous>)
    at Object.R [as aIOf] (ruxitagentjs_2SVdfjqrx_10155181109122756.js:98)
    at p (ruxitagentjs_2SVdfjqrx_10155181109122756.js:206)
    at window.require (batch.js?locale=en-US:28)
    at p (ruxitagentjs_2SVdfjqrx_10155181109122756.js:206)
    at window.require (batch.js?locale=en-US:28)
    at p (ruxitagentjs_2SVdfjqrx_10155181109122756.js:206)
    at window.require (batch.js?locale=en-US:28)
    at p (ruxitagentjs_2SVdfjqrx_10155181109122756.js:206)
    at window.require (batch.js?locale=en-US:28)
The ruxitagentjs is what points to the cause being Dynatrace agent.
Solution
Workaround
Disabling the Dynatrace agent will have Jira to work as normal again.
Resolution
Disable Dynatrace XHR monitoring setting for the agent connected to Jira application.
Was this helpful?