DVCS Stats - Performance
Platform Notice: Data Center Only - This article only applies to Atlassian apps on the Data Center platform.
Note that this KB was created for the Data Center version of the product. Data Center KBs for non-Data-Center-specific features may also work for Server versions of the product, however they have not been tested. Support for Server* products ended on February 15th 2024. If you are running a Server product, you can visit the Atlassian Server end of support announcement to review your migration options.
*Except Fisheye and Crucible
DVCS JIRA-STATS JIRA 9.8.0
Intro
DVCS-Performance stats is statistic group which inherit Jira-Stats behaviour and structure. It provides two logs in Jira log file (atlassian-jira.log) : snapshot measuring activity for 5 minute period of time and total - measuring from instance start.
DVCS-Performance is focused on monitoring DVCS synchronisation performance which measure time of adding and synchronising git repositories.
Logged statistics
Every node logs statistics that describe information about time spent on repositories synchronisation. There are two types of statistics: Snapshot and Total. More detailed information can be found here: Jira stats logs.
Each stats starts with meta-data about stats itself - name, type (total/snapshot), timestamp and etc...
Performance Stats example
{
"_statsName": "DVCS-PERFORMANCE",
"_statsType": "snapshot",
"_time": "2023-01-12T16:40:28.904Z",
"_timestamp": 1673541628904,
"_duration": "PT4M59.992S",
"_invocations": 0,
"_statsOverhead": "n/a",
"_nodeId": "n/a",
"topNHourlySyncOrganisationsInMillis": {
"Organisation-1": 2523,
"Organisation-2": 1344,
"Organisation-3": 225,
"Organisation-4": 25,
"Organisation-5": 11
},
"hourlyOrganisationSynchronisationTimeInMillis": {
"count": 0,
"min": 0,
"max": 0,
"sum": 0,
"avg": 0,
"distributionCounter": {
"10": 0,
"100": 0,
"1000": 0,
"10000": 0,
"100000": 0,
"1_000_000": 0,
"10_000_000": 0
}
},
"topNSyncOrRefreshOrganisationsInMillis": {
"Organisation-1": 2523,
"Organisation-2": 1344,
"Organisation-3": 225,
"Organisation-4": 25,
"Organisation-5": 11
},
"syncOrRefreshOrgTimeInMillis": {
"count": 0,
"min": 0,
"max": 0,
"sum": 0,
"avg": 0,
"distributionCounter": {
"10": 0,
"100": 0,
"1000": 0,
"10000": 0,
"100000": 0,
"1_000_000": 0,
"10_000_000": 0
}
},
"topNSyncRepositoriesInMillis": {
"repo-1/org-1": 2343,
"repo-5/org-2": 2242,
"repo-2/org-1": 214,
"repo-4/org-3": 21
},
"repositorySyncTimeInMillis": {
"count": 0,
"min": 0,
"max": 0,
"sum": 0,
"avg": 0,
"distributionCounter": {
"10": 0,
"100": 0,
"1000": 0,
"10000": 0,
"100000": 0,
"1_000_000": 0,
"10_000_000": 0
}
},
"newReposByFetchingBranchesSyncTimeInMillis": {
"count": 0,
"min": 0,
"max": 0,
"sum": 0,
"avg": 0,
"distributionCounter": {
"10": 0,
"100": 0,
"1000": 0,
"10000": 0,
"100000": 0,
"1_000_000": 0,
"10_000_000": 0
}
},
"topNNewReposByFetchingBranchesSyncTimeInMillis": {
"repo-1/org-1": 2343,
"repo-5/org-2": 2242,
"repo-2/org-1": 214,
"repo-4/org-3": 21
},
"hourlySyncClusterLockNotAvailableCount": 24,
"addOrgOrRefreshSyncClusterLockNotAvailableCount": 14
}
In this stats we are monitoring following:
Performance stats are related in general to time spent on adding new repositories and hourly synchronisation (or forced manually by user) time for synchronise already linked ones.
Parameter | Description | Recommended value |
|---|---|---|
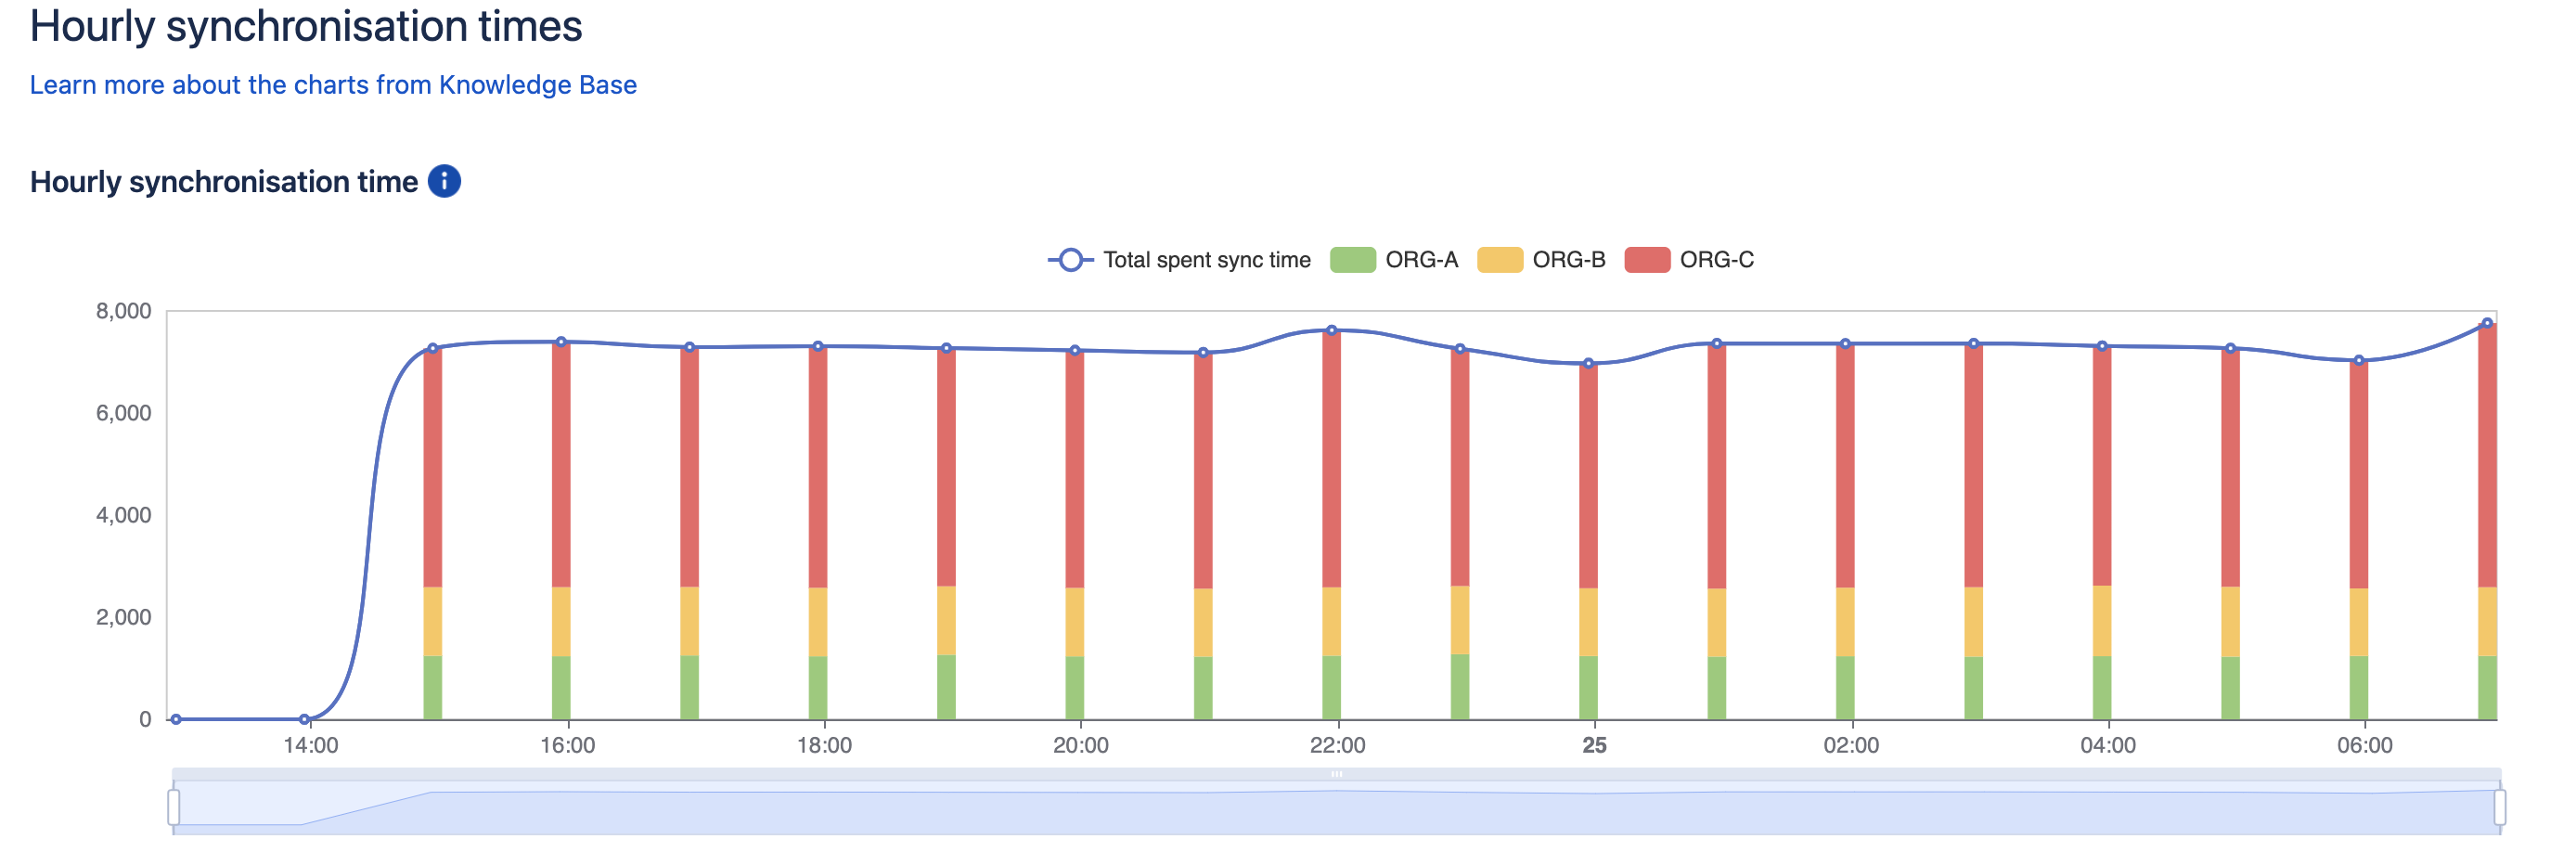
topNHourlySyncOrganisationsInMillis | Represent top git organisation which need most time during hourly sync to fetch new data. | N/A |
hourlyOrganisationSynchronisationTimeInMillis | Hourly synchronisation time statistic. | N/A |
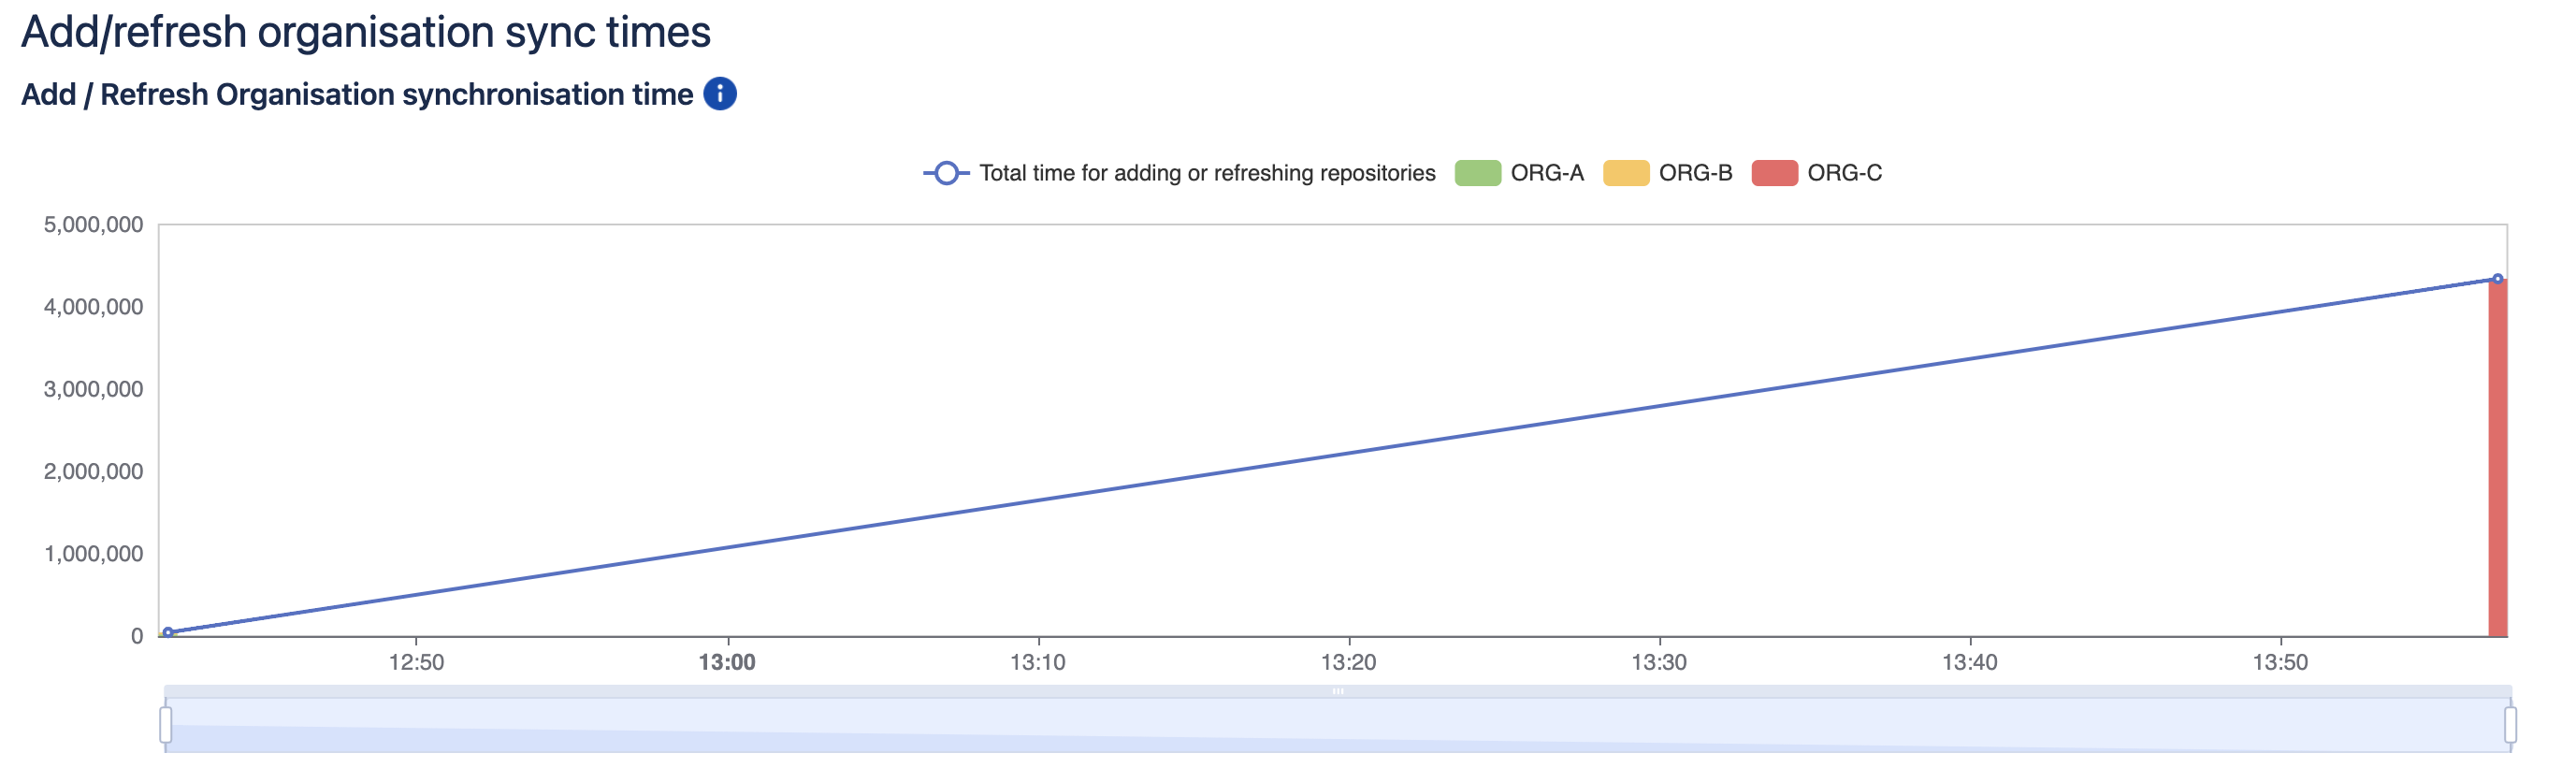
topNSyncOrRefreshOrganisationsInMillis | Represent top git organisation which need most time during linking or refreshing organisation process. | N/A |
syncOrRefreshOrgTimeInMillis | Adding new organisation or refreshing already existing ones time statistic. | N/A |
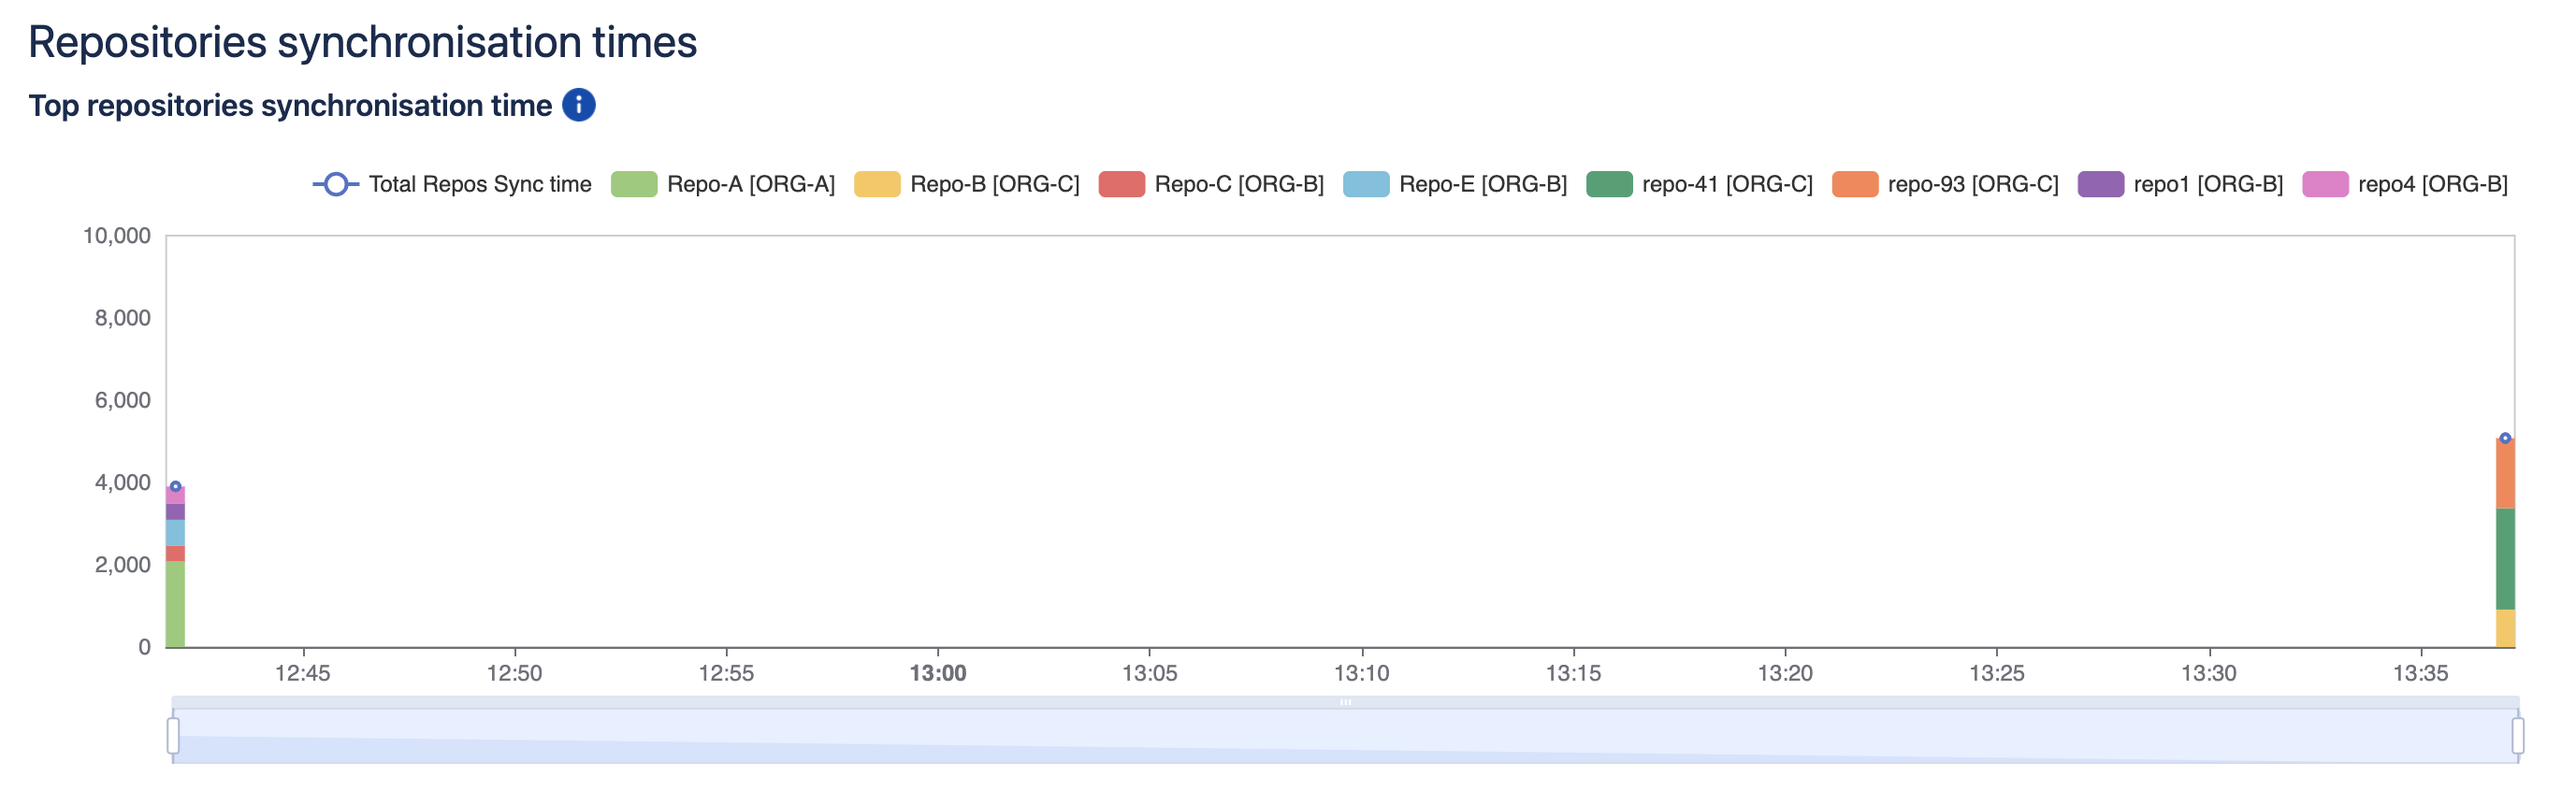
topNSyncRepositoriesInMillis | Represent top git repositories which need most time during sync to fetch new data. | N/A |
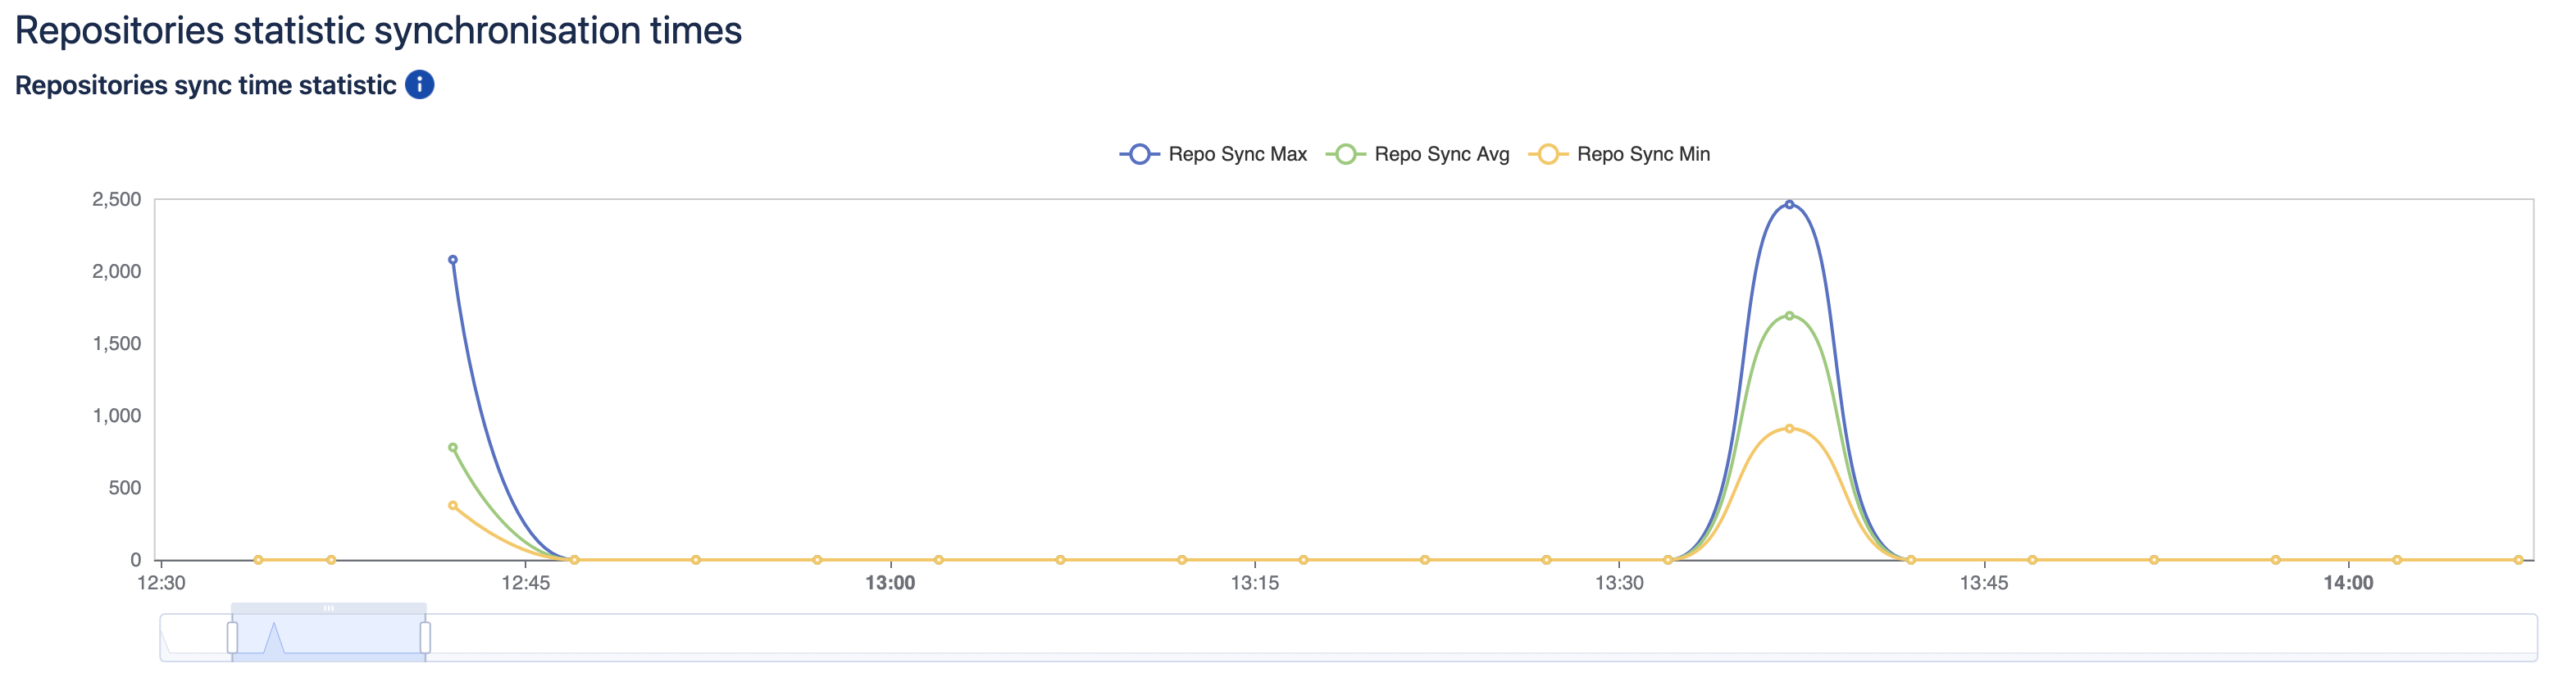
repositorySyncTimeInMillis | Repositories synchronisation statistics. | N/A |
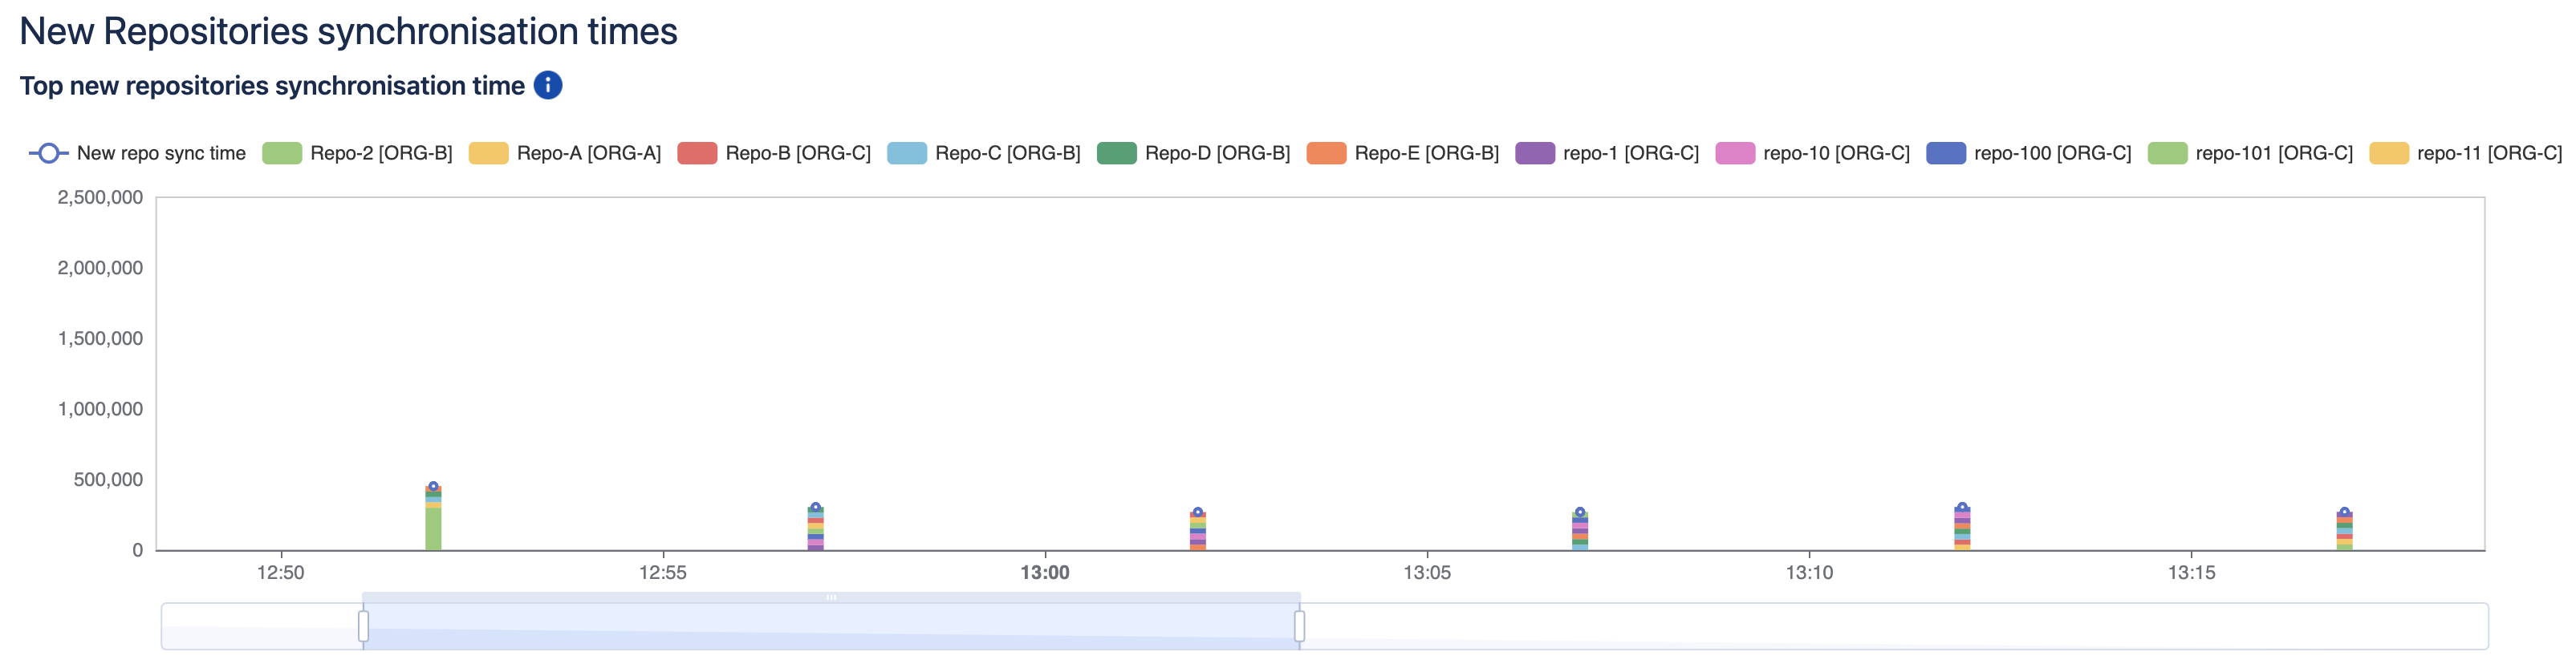
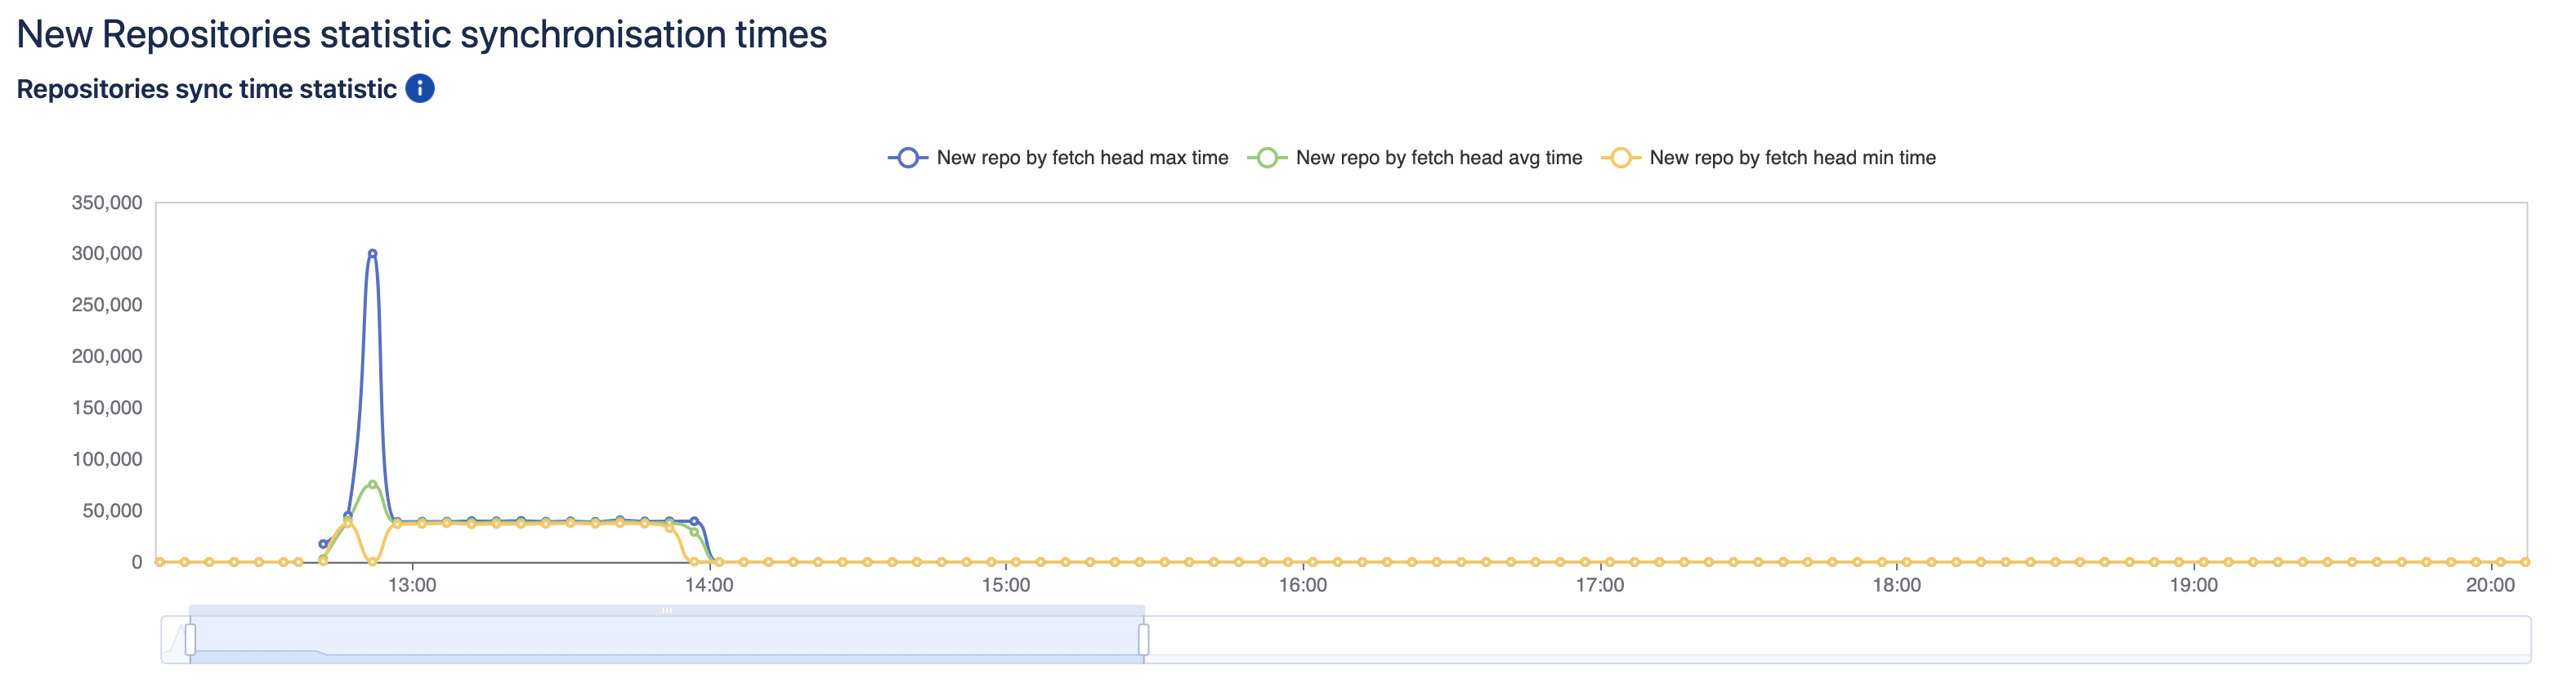
newReposByFetchingBranchesSyncTimeInMillis | Linking new repositories statistic. | N/A |
topNNewReposByFetchingBranchesSyncTimeInMillis | Represent top git repositories which need most time during linking process. | N/A |
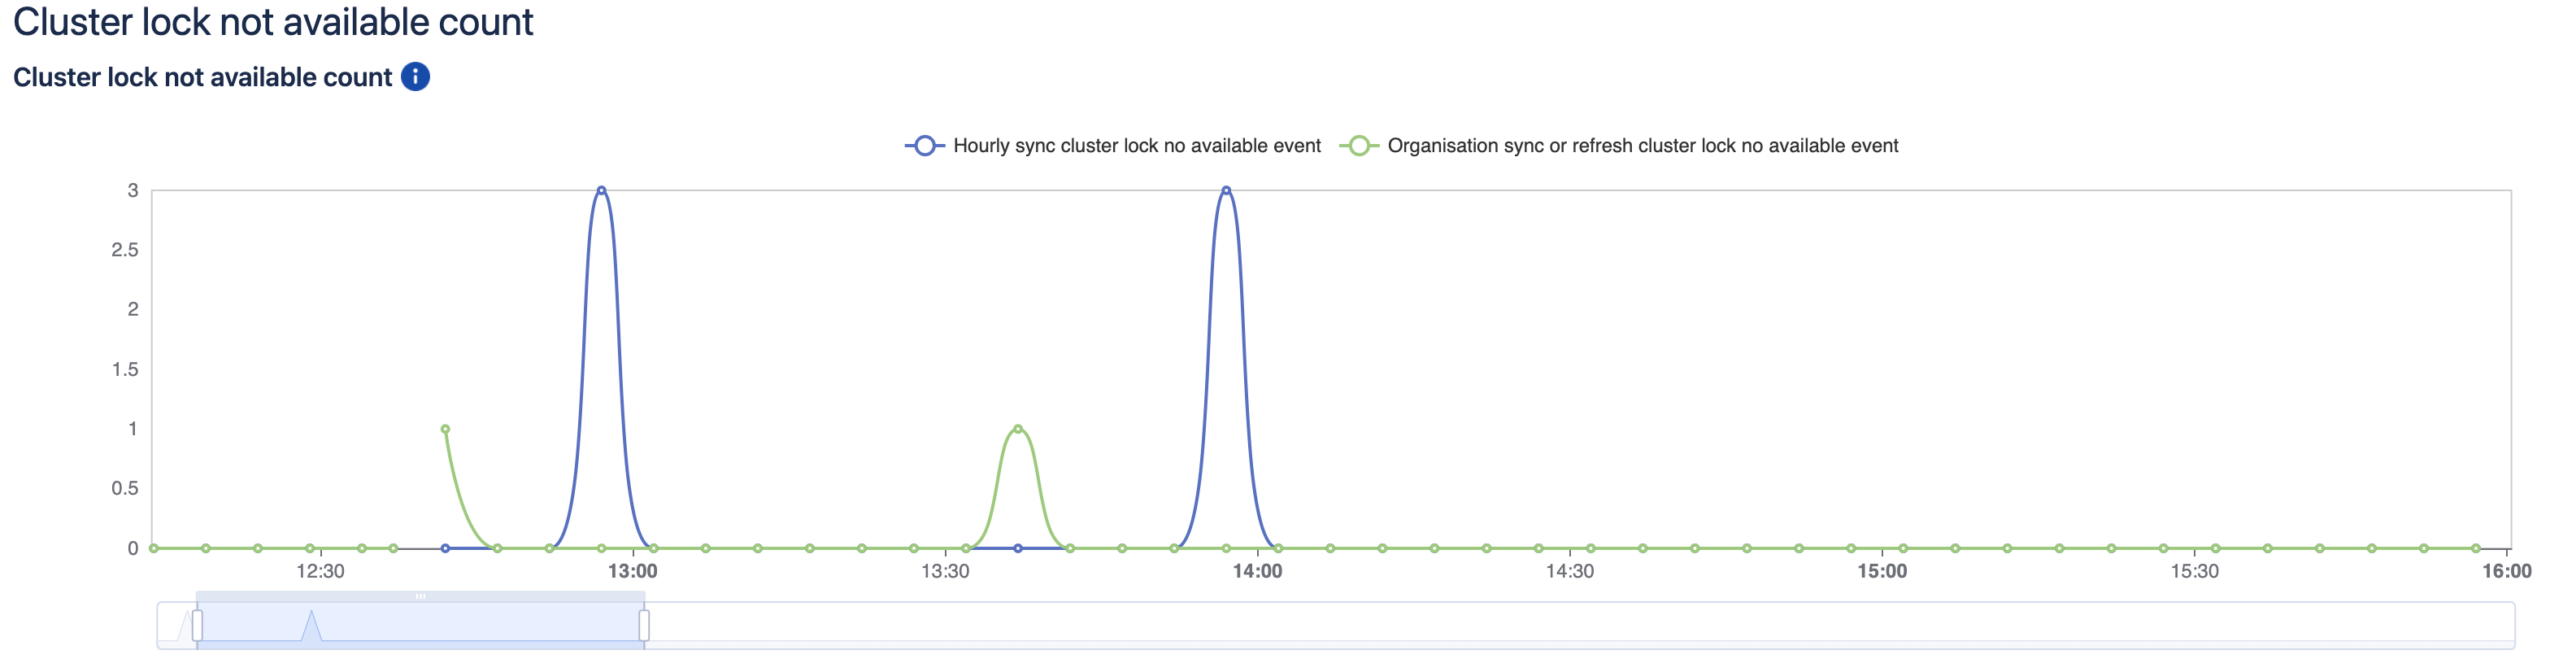
hourlySyncClusterLockNotAvailableCount | Counter showing how many times DVCS couldn't start hourly synchronisation because cluster lock was not available. | N/A |
addOrgOrRefreshSyncClusterLockNotAvailableCount | Counter showing how many times DVCS couldn't link new organisation or refresh existing because cluster lock was not available. | N/A |
Was this helpful?