DVCS Stats - HTTP
Platform Notice: Data Center Only - This article only applies to Atlassian apps on the Data Center platform.
Note that this KB was created for the Data Center version of the product. Data Center KBs for non-Data-Center-specific features may also work for Server versions of the product, however they have not been tested. Support for Server* products ended on February 15th 2024. If you are running a Server product, you can visit the Atlassian Server end of support announcement to review your migration options.
*Except Fisheye and Crucible
Summary
DVCS, JIRA-STATS, JIRA 9.8.0
Solution
Intro
DVCS-HTTP stats is statistic group which inherit Jira-Stats behaviour and structure. It provides two logs in Jira log file (atlassian-jira.log) : snapshot measuring activity for 5 minute period of time and total - measuring from instance start.
DVCS-HTTP is focused on monitoring HTTP traffic which can be divided to two streams : Inbound stream (request which DVCS accept and process) and Outbound stream (requests which DVCS generates and sent).
Logged statistics
Every node logs statistics that describe information about inbound and outbound traffic. There are two types of statistics: Snapshot and Total. More detailed information can be found here: Jira stats logs.
Each stats starts with meta-data about stats itself - name, type (total/snapshot), timestamp and etc...
HTTP Stats example
{
"_statsName": "DVCS-HTTP",
"_statsType": "snapshot",
"_time": "2023-02-08T15:01:58.735Z",
"_timestamp": 1675868518735,
"_duration": "PT5M0.004S",
"_invocations": 0,
"_statsOverhead": "n/a",
"nodeId": "n/a",
"inbound": {
"legacyHookCount": 0,
"hookCount": 0,
"pushHookInMillis": {
"count": 0,
"min": 0,
"max": 0,
"sum": 0,
"avg": 0,
"distributionCounter": {
"100": 0,
"200": 0,
"400": 0,
"700": 0,
"1000": 0,
"2000": 0,
"5000": 0,
"10000": 0,
"30000": 0
}
},
"pullHookInMillis": {
"count": 0,
"min": 0,
"max": 0,
"sum": 0,
"avg": 0,
"distributionCounter": {
"100": 0,
"200": 0,
"400": 0,
"700": 0,
"1000": 0,
"2000": 0,
"5000": 0,
"10000": 0,
"30000": 0
}
},
"hookTopNRepositories": {},
"dvcsTypes": {
"githube": 0,
"github": 0,
"gitlab": 0,
"bitbucket": 0,
"gitlabselfmanaged": 0
},
"legacyHookTopNRepositories": {
"repo-1 [org_name]": 230,
"repo-2 [org_namx]": 120
}
},
"outbound": {
"requestToGitInMillis": {
"count": 0,
"min": 0,
"max": 0,
"sum": 0,
"avg": 0,
"distributionCounter": {
"100": 0,
"1000": 0,
"2000": 0,
"5000": 0,
"10000": 0,
"30000": 0
}
},
"errorRequestToGitInMillis": {
"count": 0,
"min": 0,
"max": 0,
"sum": 0,
"avg": 0,
"distributionCounter": {
"100": 0,
"1000": 0,
"2000": 0,
"5000": 0,
"10000": 0,
"30000": 0
}
},
"repositoryRequestToGitInMillis": {
"count": 0,
"min": 0,
"max": 0,
"sum": 0,
"avg": 0,
"distributionCounter": {
"100": 0,
"1000": 0,
"5000": 0,
"10000": 0,
"20000": 0,
"30000": 0,
"60000": 0,
"120000": 0,
"240000": 0
}
},
"branchRequestToGitInMillis": {
"count": 0,
"min": 0,
"max": 0,
"sum": 0,
"avg": 0,
"distributionCounter": {
"100": 0,
"500": 0,
"1000": 0,
"5000": 0,
"10000": 0,
"30000": 0
}
},
"commitRequestToGitInMillis": {
"count": 0,
"min": 0,
"max": 0,
"sum": 0,
"avg": 0,
"distributionCounter": {
"100": 0,
"500": 0,
"1000": 0,
"5000": 0,
"10000": 0,
"30000": 0
}
},
"prRequestToGitInMillis": {
"count": 0,
"min": 0,
"max": 0,
"sum": 0,
"avg": 0,
"distributionCounter": {
"100": 0,
"500": 0,
"1000": 0,
"5000": 0,
"10000": 0,
"30000": 0
}
},
"repositoriesResponseSize": {
"count": 0,
"min": 0,
"max": 0,
"sum": 0,
"avg": 0,
"distributionCounter": {
"50": 0,
"100": 0,
"500": 0,
"1000": 0,
"5000": 0,
"10000": 0,
"50000": 0,
"100000": 0
}
},
"branchesResponseSize": {
"count": 0,
"min": 0,
"max": 0,
"sum": 0,
"avg": 0,
"distributionCounter": {
"50": 0,
"100": 0,
"500": 0,
"1000": 0,
"5000": 0,
"10000": 0,
"50000": 0,
"100000": 0
}
},
"topNRepositories": {
"repo-1 [org_name]": 230,
"repo-2 [org_name3]": 120
},
"topNErrors": {
"Exception": 435,
"SourceControl Exception": 123
},
"responseStatus": {
"OK": 435,
"Rate limit": 123,
"Unknown": 120
},
"dvcsTypes": {
"githube": 0,
"github": 0,
"gitlab": 0,
"bitbucket": 0,
"gitlabselfmanaged": 0
}
}
}
In this stats we are monitoring following subgroups :
To be more convenient stats will be split to two tables - inbound and outbound.
*It is hard to create standards for different stats
because it have dozens of dependencies:
DB type, Configuration, Hardware, OS, Organisation Size,
Repositories amount, Organisation amount, Commits,
Branches, HTTP traffic and many more.
Inbound subgroup:
Parameter | Description | Recommended value |
|---|---|---|
legacyHookCount | This metric will provide information if legacy webhooks are still used by customer. (used before JIRA 8.14.X) | N/A |
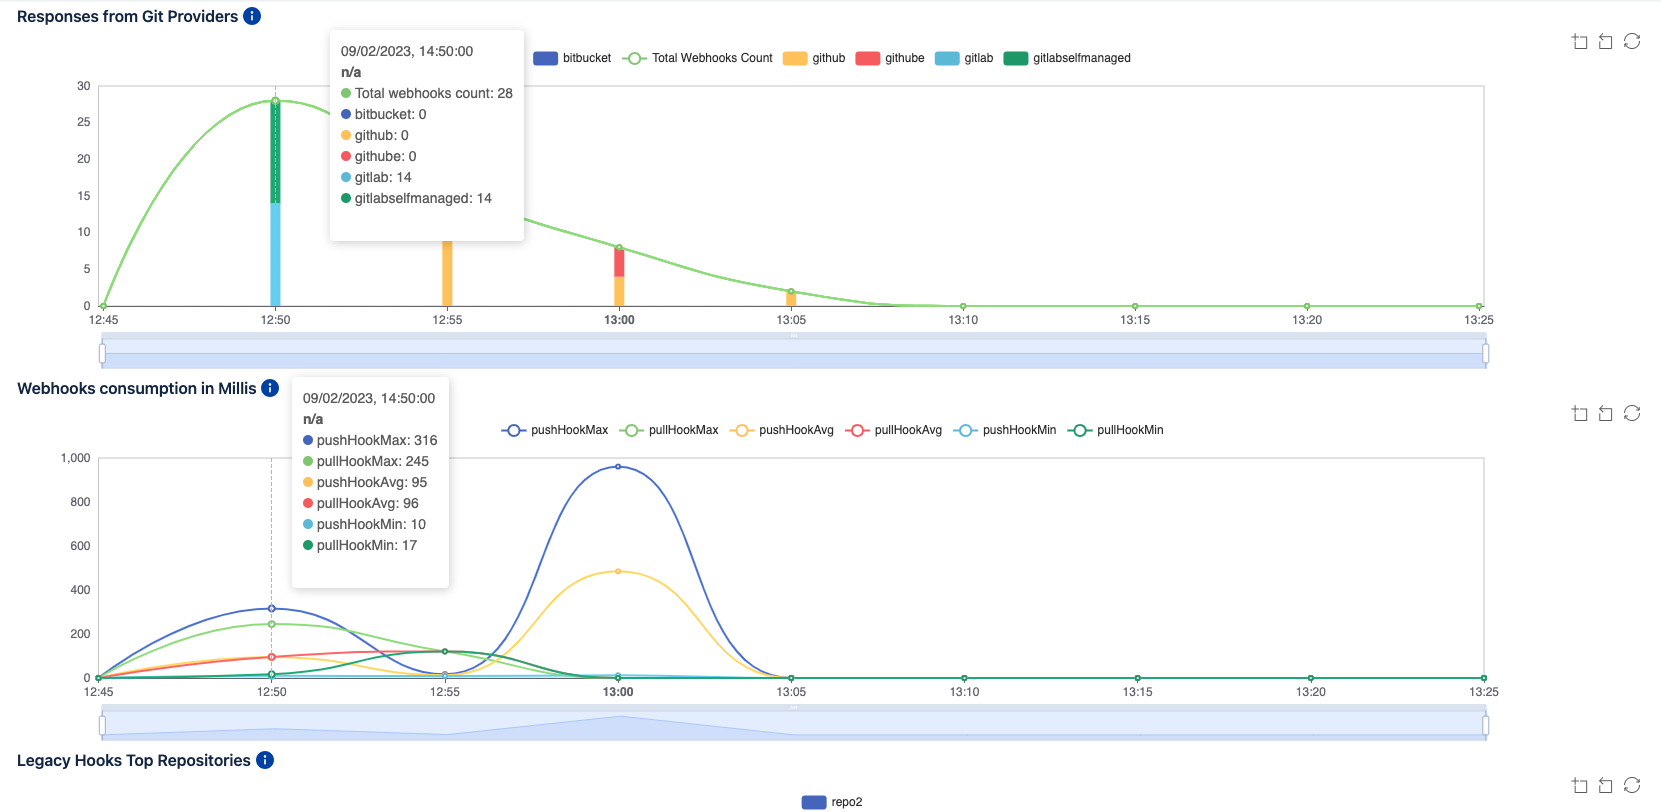
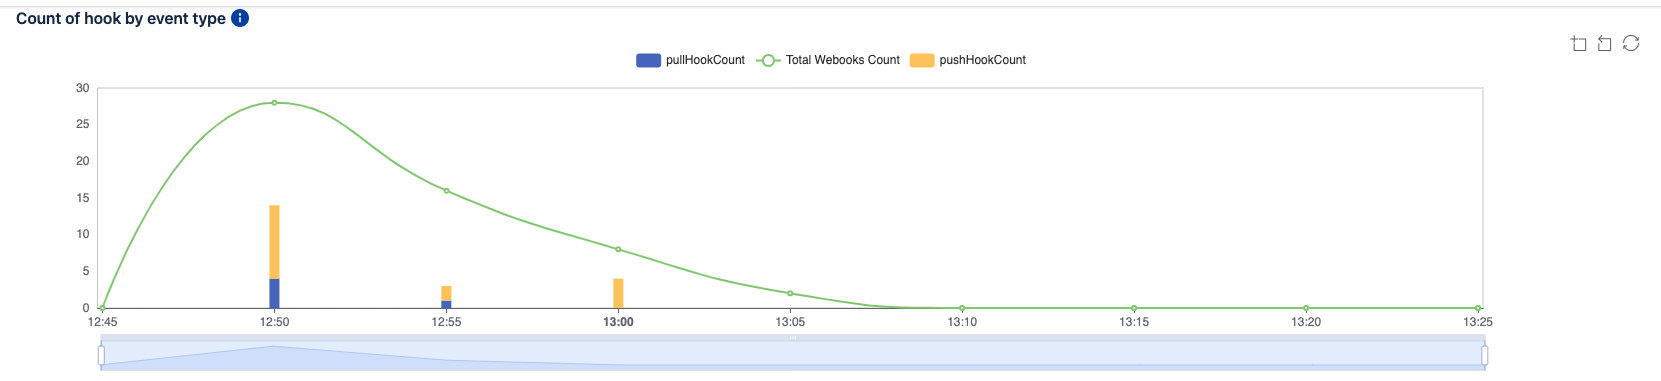
hookCount | All webhooks count which are accepted. | N/A |
pushHookInMillis | All webhooks describing "push" type events. | N/A |
pullHookInMillis | All webhooks describing "pull" type events. | N/A |
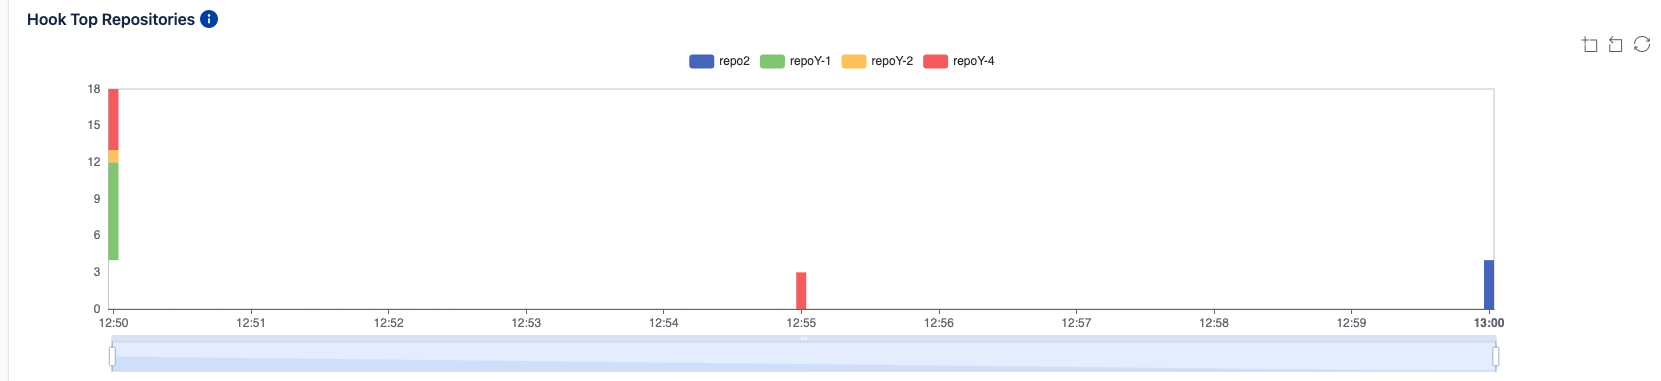
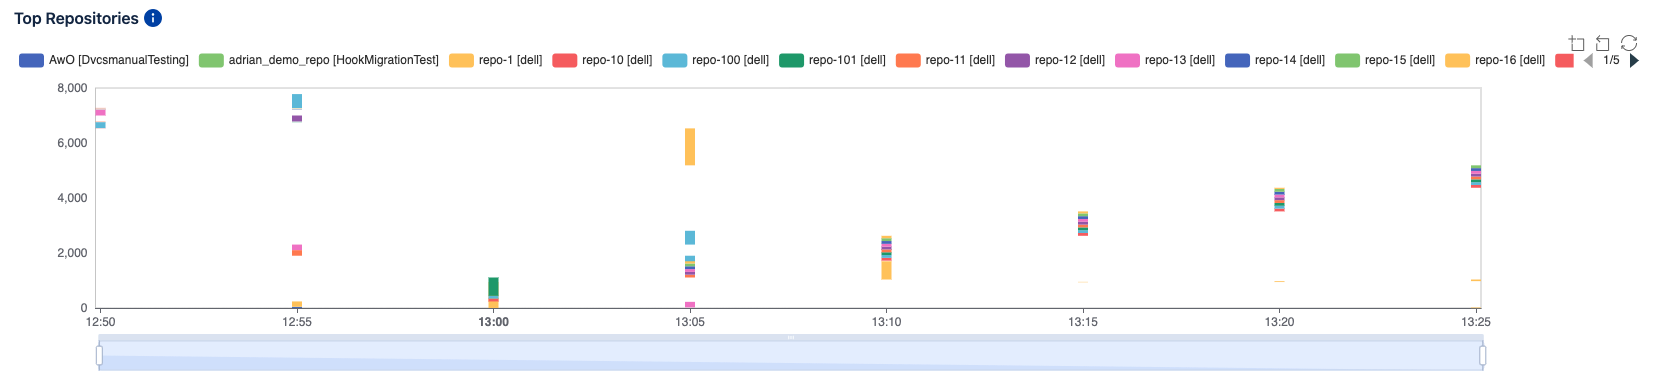
hookTopNRepositories | Provide top 10 (by default) repositories which generates highest amount of webhooks. | N/A |
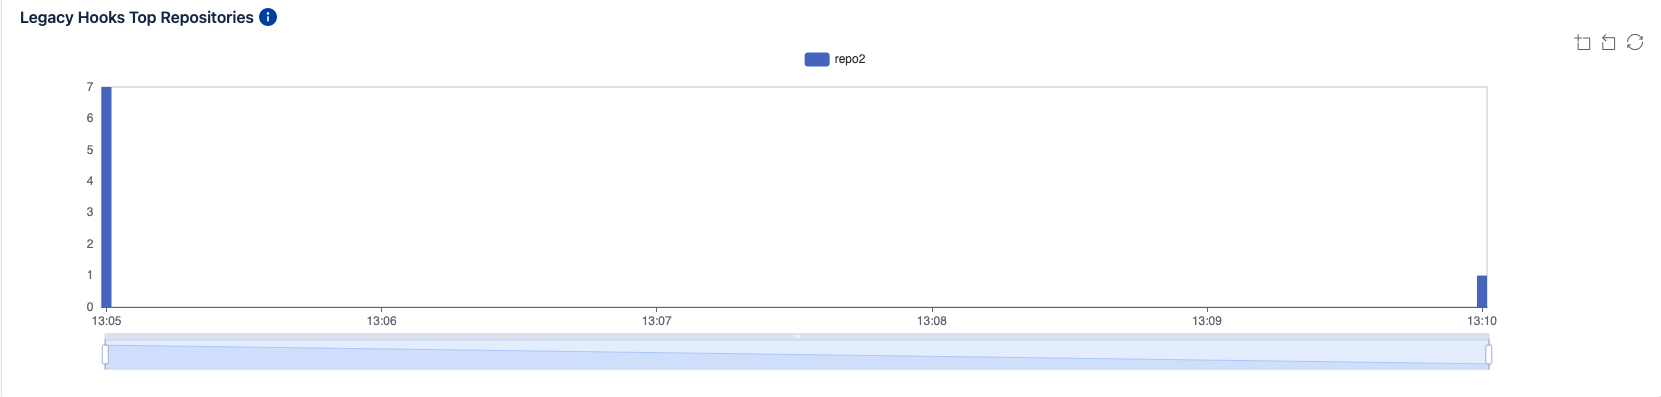
legacyHookTopNRepositories | Provide top 10 (by default) repositories which generates legacy webhooks. After Jira 8.13.X webhooks were changed to be more efficient. | N/A |
Outbound subgroup:
Parameter | Description | Recommended value |
|---|---|---|
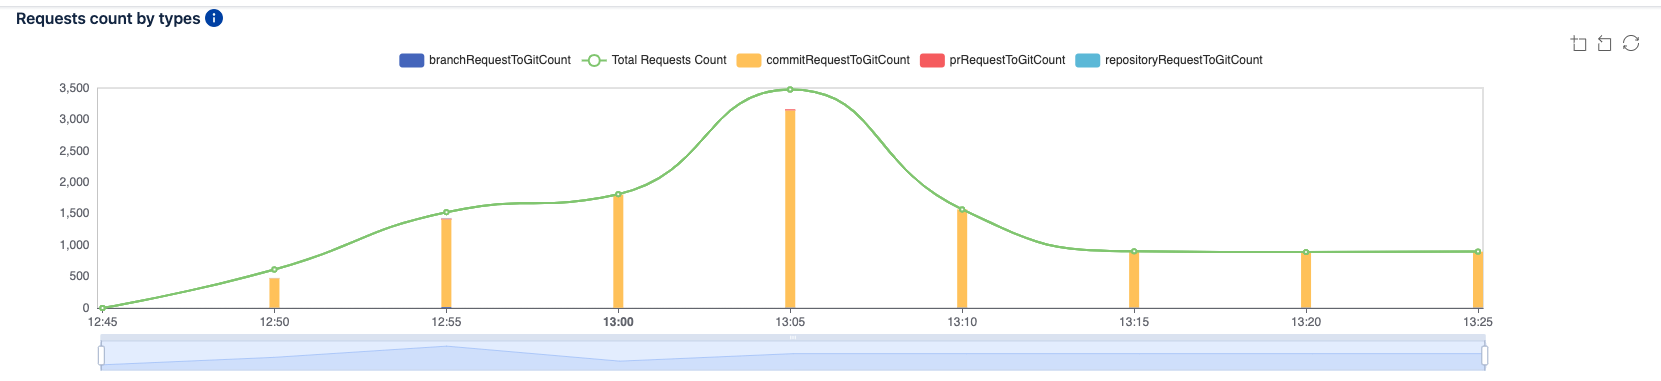
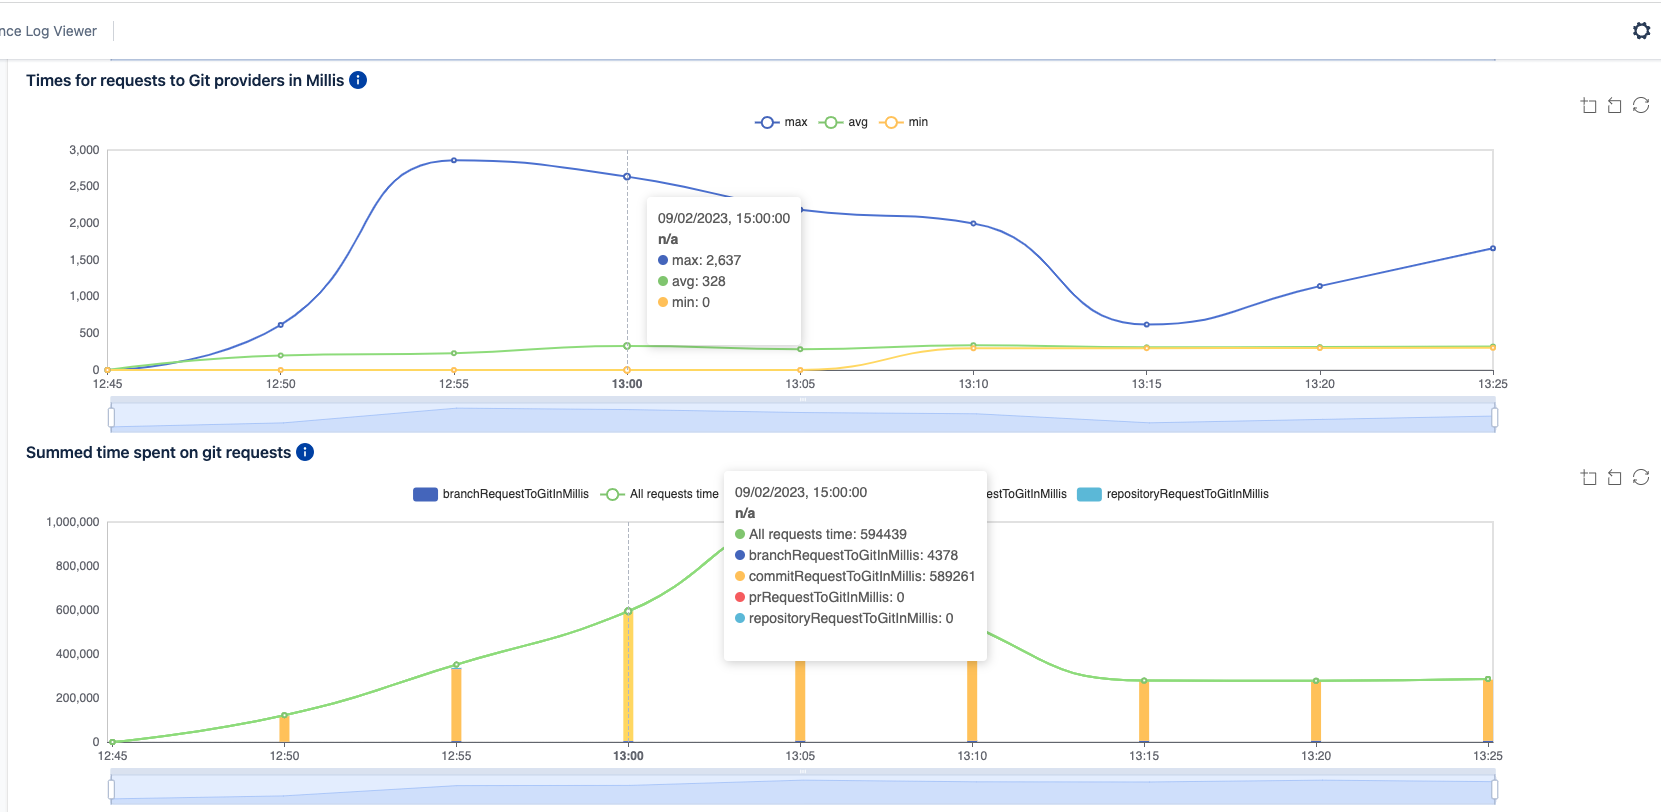
requestToGitInMillis | All requests count and distribution by time in milliseconds. | N/A |
errorRequestToGitInMillis | All requests count with error response codes. Example - rate limit exceed, repository not found, unauthorised requests. | 0 |
repositoryRequestToGitInMillis | All requests count and distribution by times in ms executed on repository level. | N/A |
branchRequestToGitInMillis | All requests count and distribution by times in ms executed on branch level. | N/A |
commitRequestToGitInMillis | All requests count and distribution by times in ms executed on commit level. | N/A |
prRequestToGitInMillis | All requests count and distribution by times in ms executed on pull request level. | N/A |
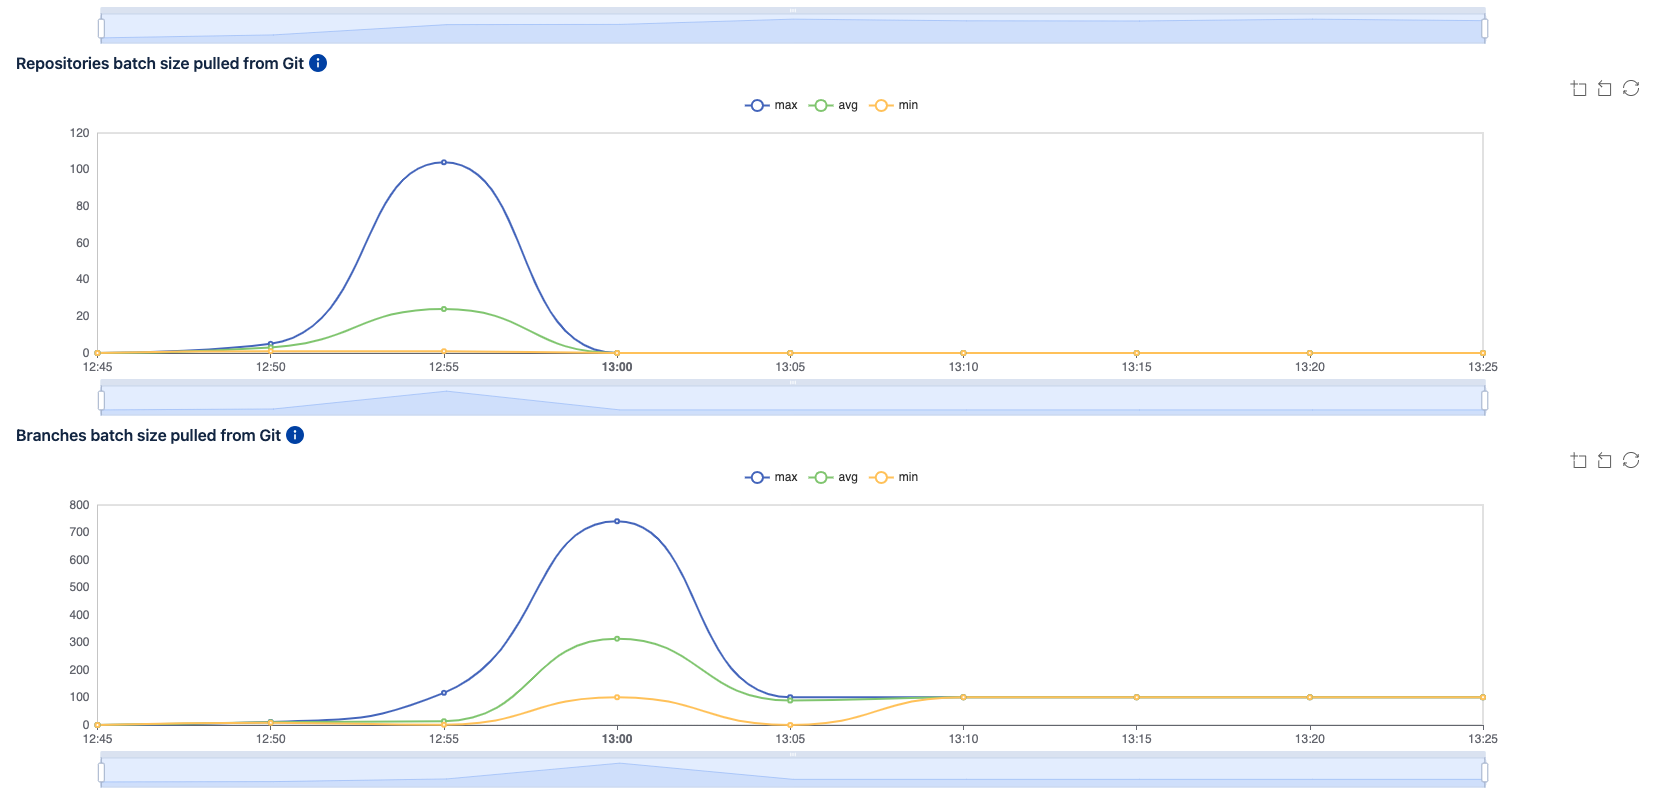
repositoriesResponseSize | Metric providing count of repositories fetched for synchronisation. | N/A |
branchesResponseSize | Metric providing count of branches fetched for synchronisation. | N/A |
topNRepositories | Provide top 10 repositories generating outbound traffic in descending order. | N/A |
topNErrors | Provide top 15 most common errors which appear in descending order | N/A |
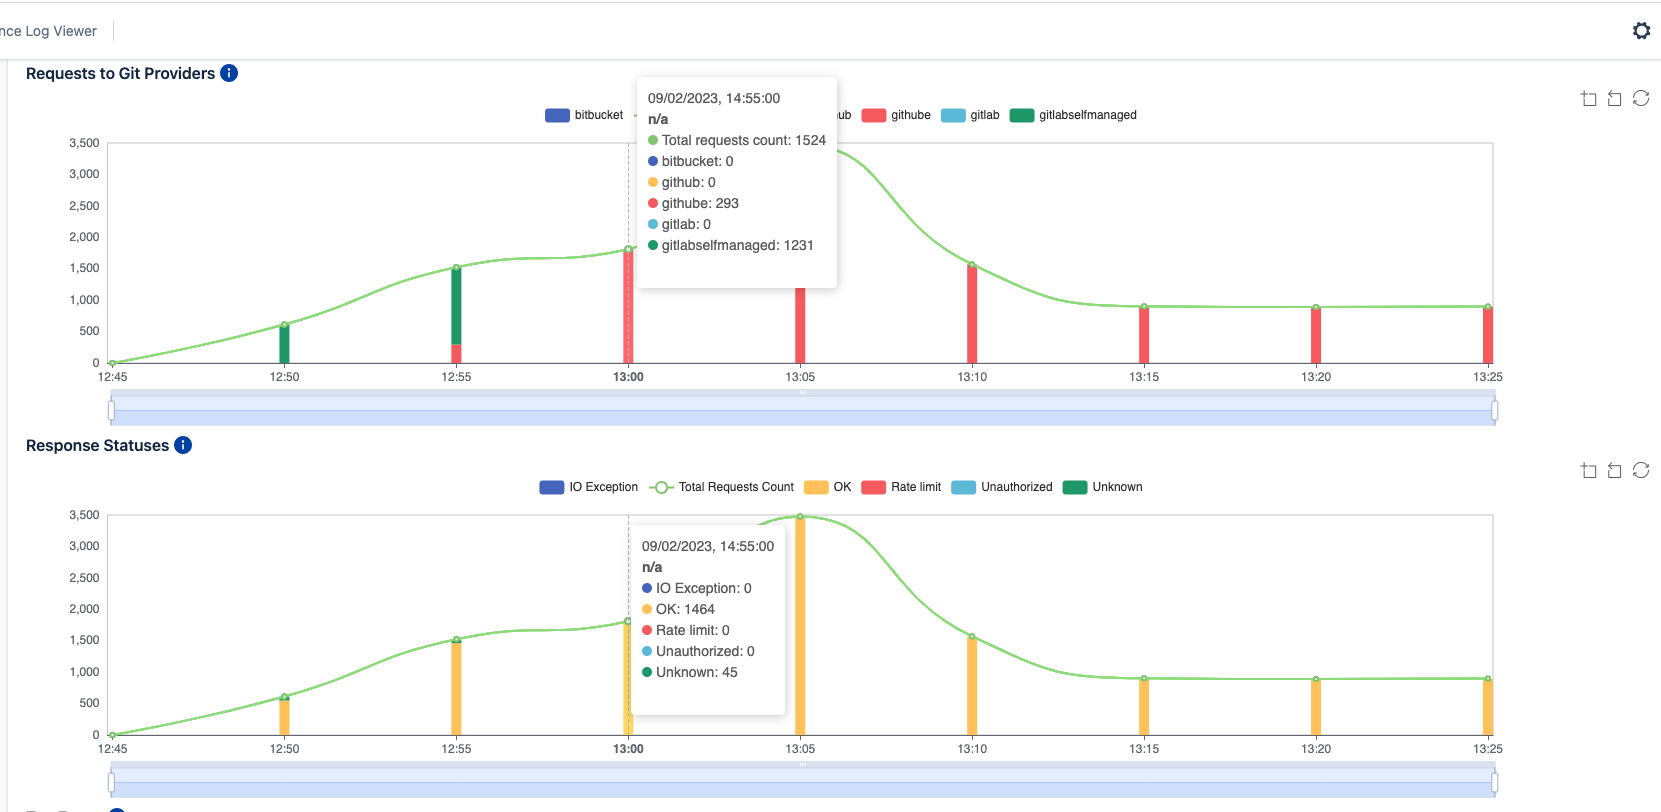
responseStatus | Provide top 15 most common response statuses in descending order | N/A |
dvcsTypes | Provide information about outbound traffic generated by dvcs types (git providers). | N/A |
Was this helpful?