Display the actual or elapsed time of SLA's using Automation in JSM Cloud
Platform Notice: Cloud Only - This article only applies to Atlassian apps on the cloud platform.
Summary
Learn how to calculate and export the elapsed time for SLAs in Jira Service Management when only the remaining time is displayed.
Solution
How it works
JSM displays the remaining SLA time by default. This rule copies the elapsed time of each SLA cycle into a text custom field so it can be viewed on the issue and exported to CSV. You'll create one text field per SLA metric (for example, Time to First Response and Time to Resolution).
Configure an automation rule to store SLA elapsed time in a custom field
1. Create separate Text Field (single line) custom fields to store SLA elapsed time values for each metric, such as 'Time to First Response' and 'Time to Resolution.'
2. Go to your Service project Project Settings > Automation > Create a rule.
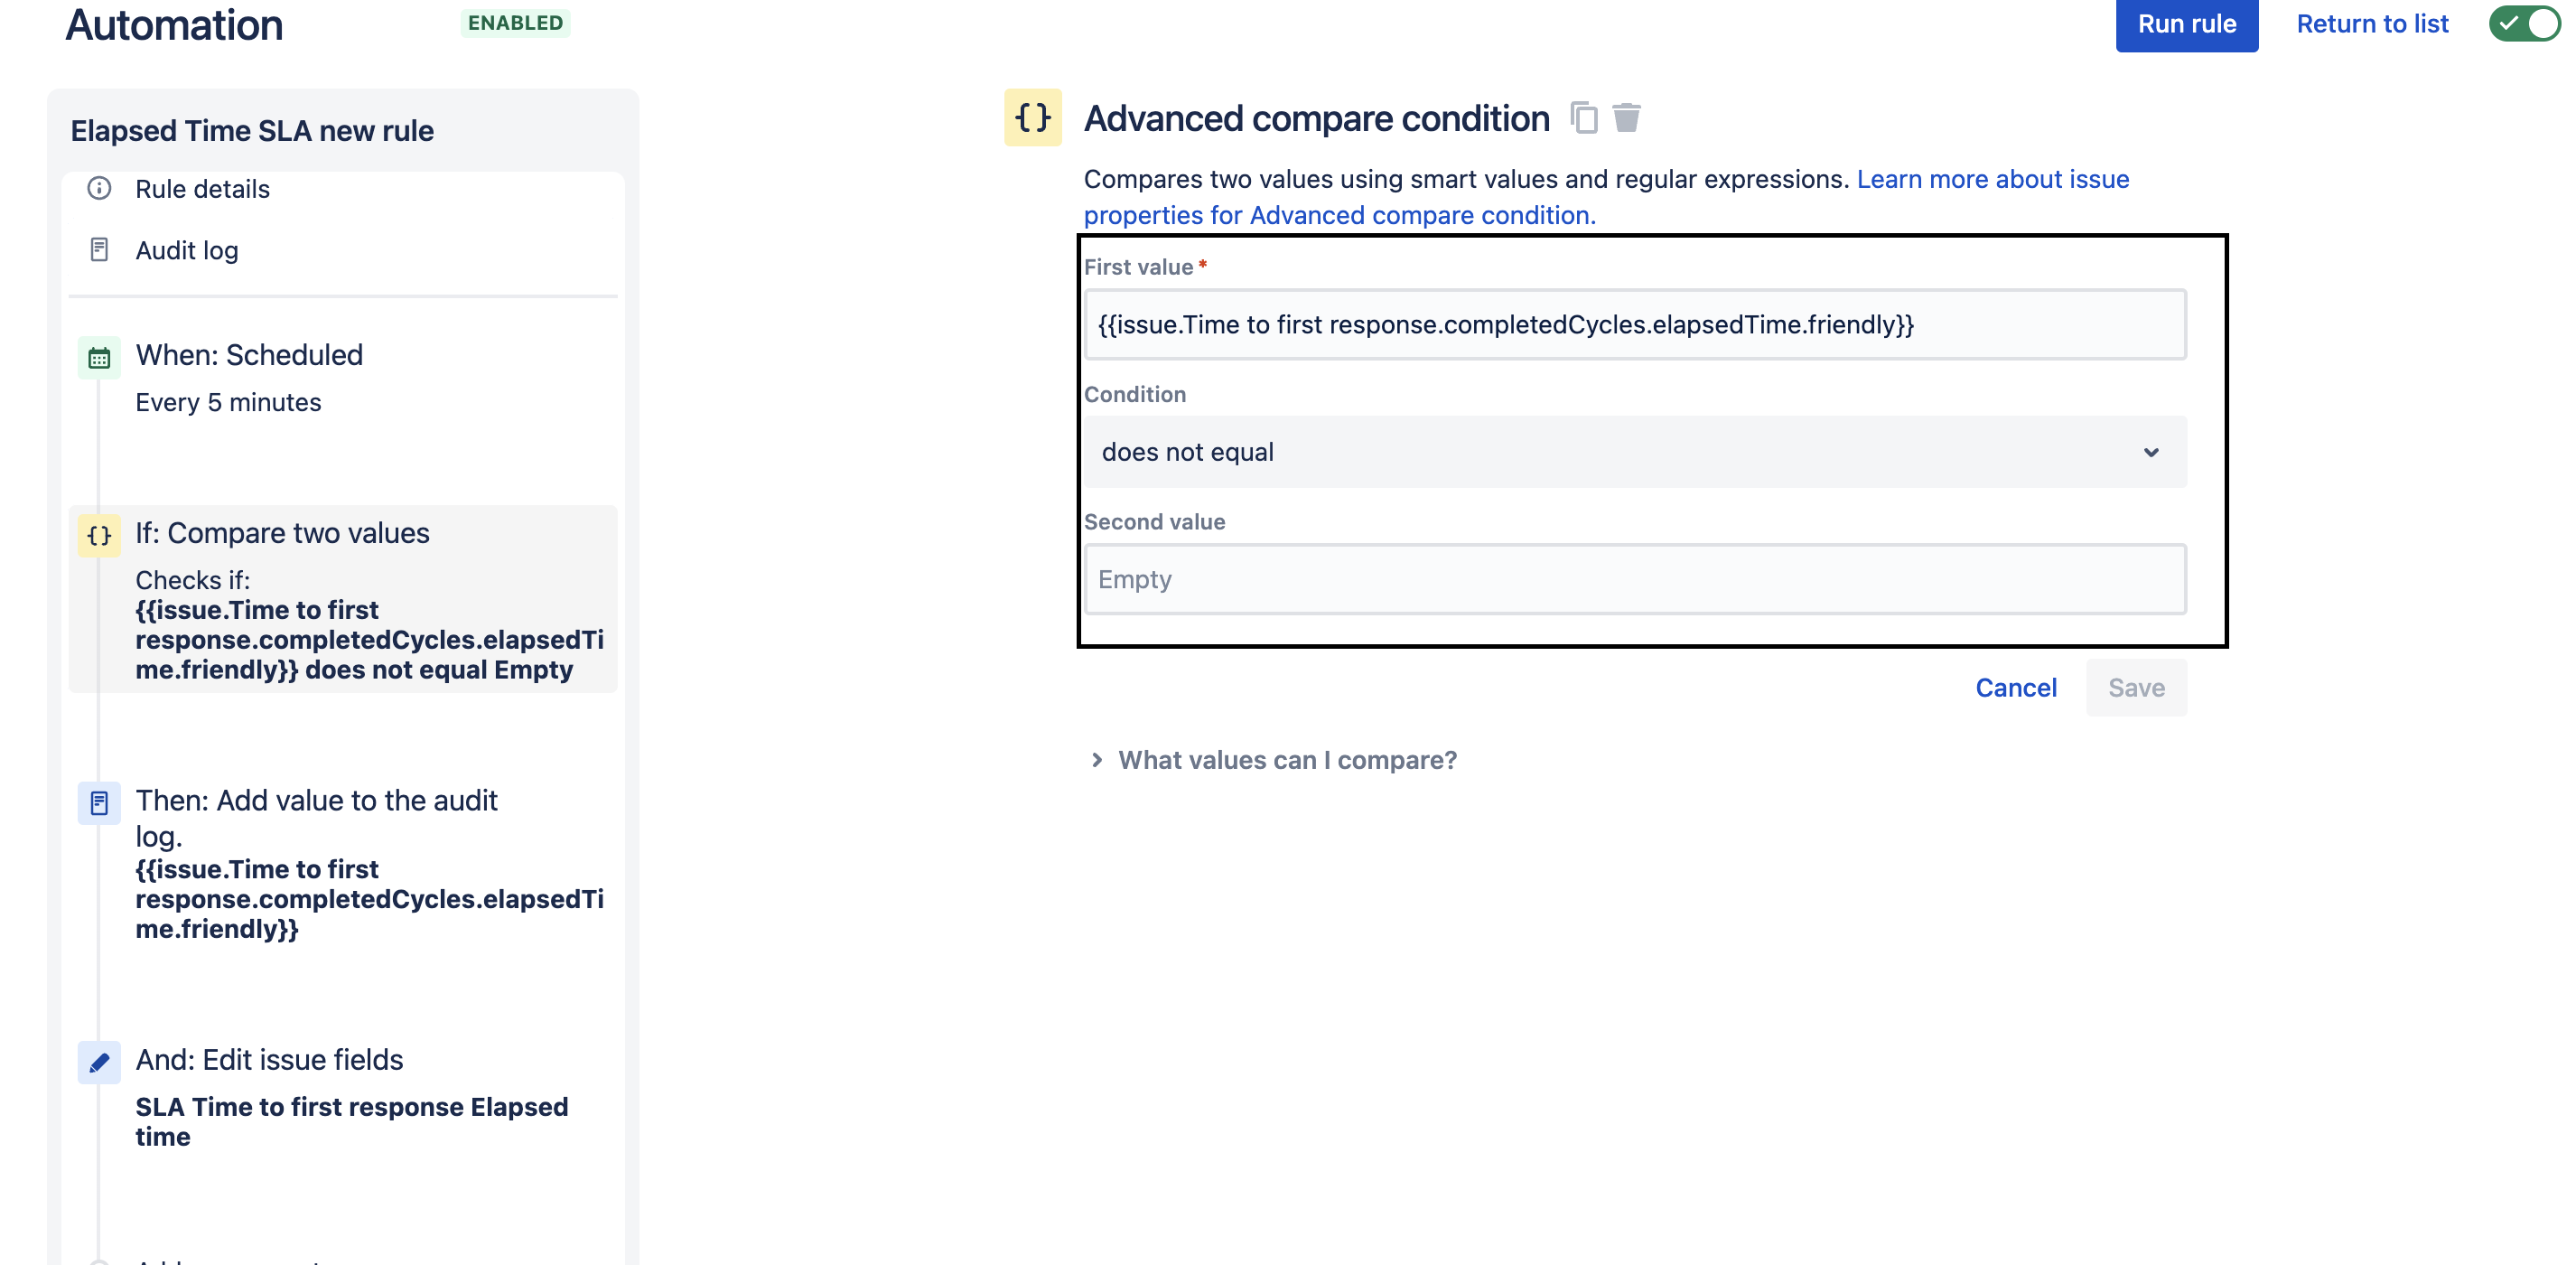
3. The Automation rule structure should be as shown below.
Trigger - Scheduled.
Condition: Advanced compare condition to check the Time to first response SLA is not empty.
{{issue.Time to first response.completedCycles.elapsedTime.friendly}}Replace Time to first response with the exact SLA name for other metrics (for example Time to resolution). The .friendly suffix returns a human-readable duration.
Action - Edit work item > Select the custom field created from the drop-down to store this value.
{{issue.Time to first response.completedCycles.elapsedTime.friendly}}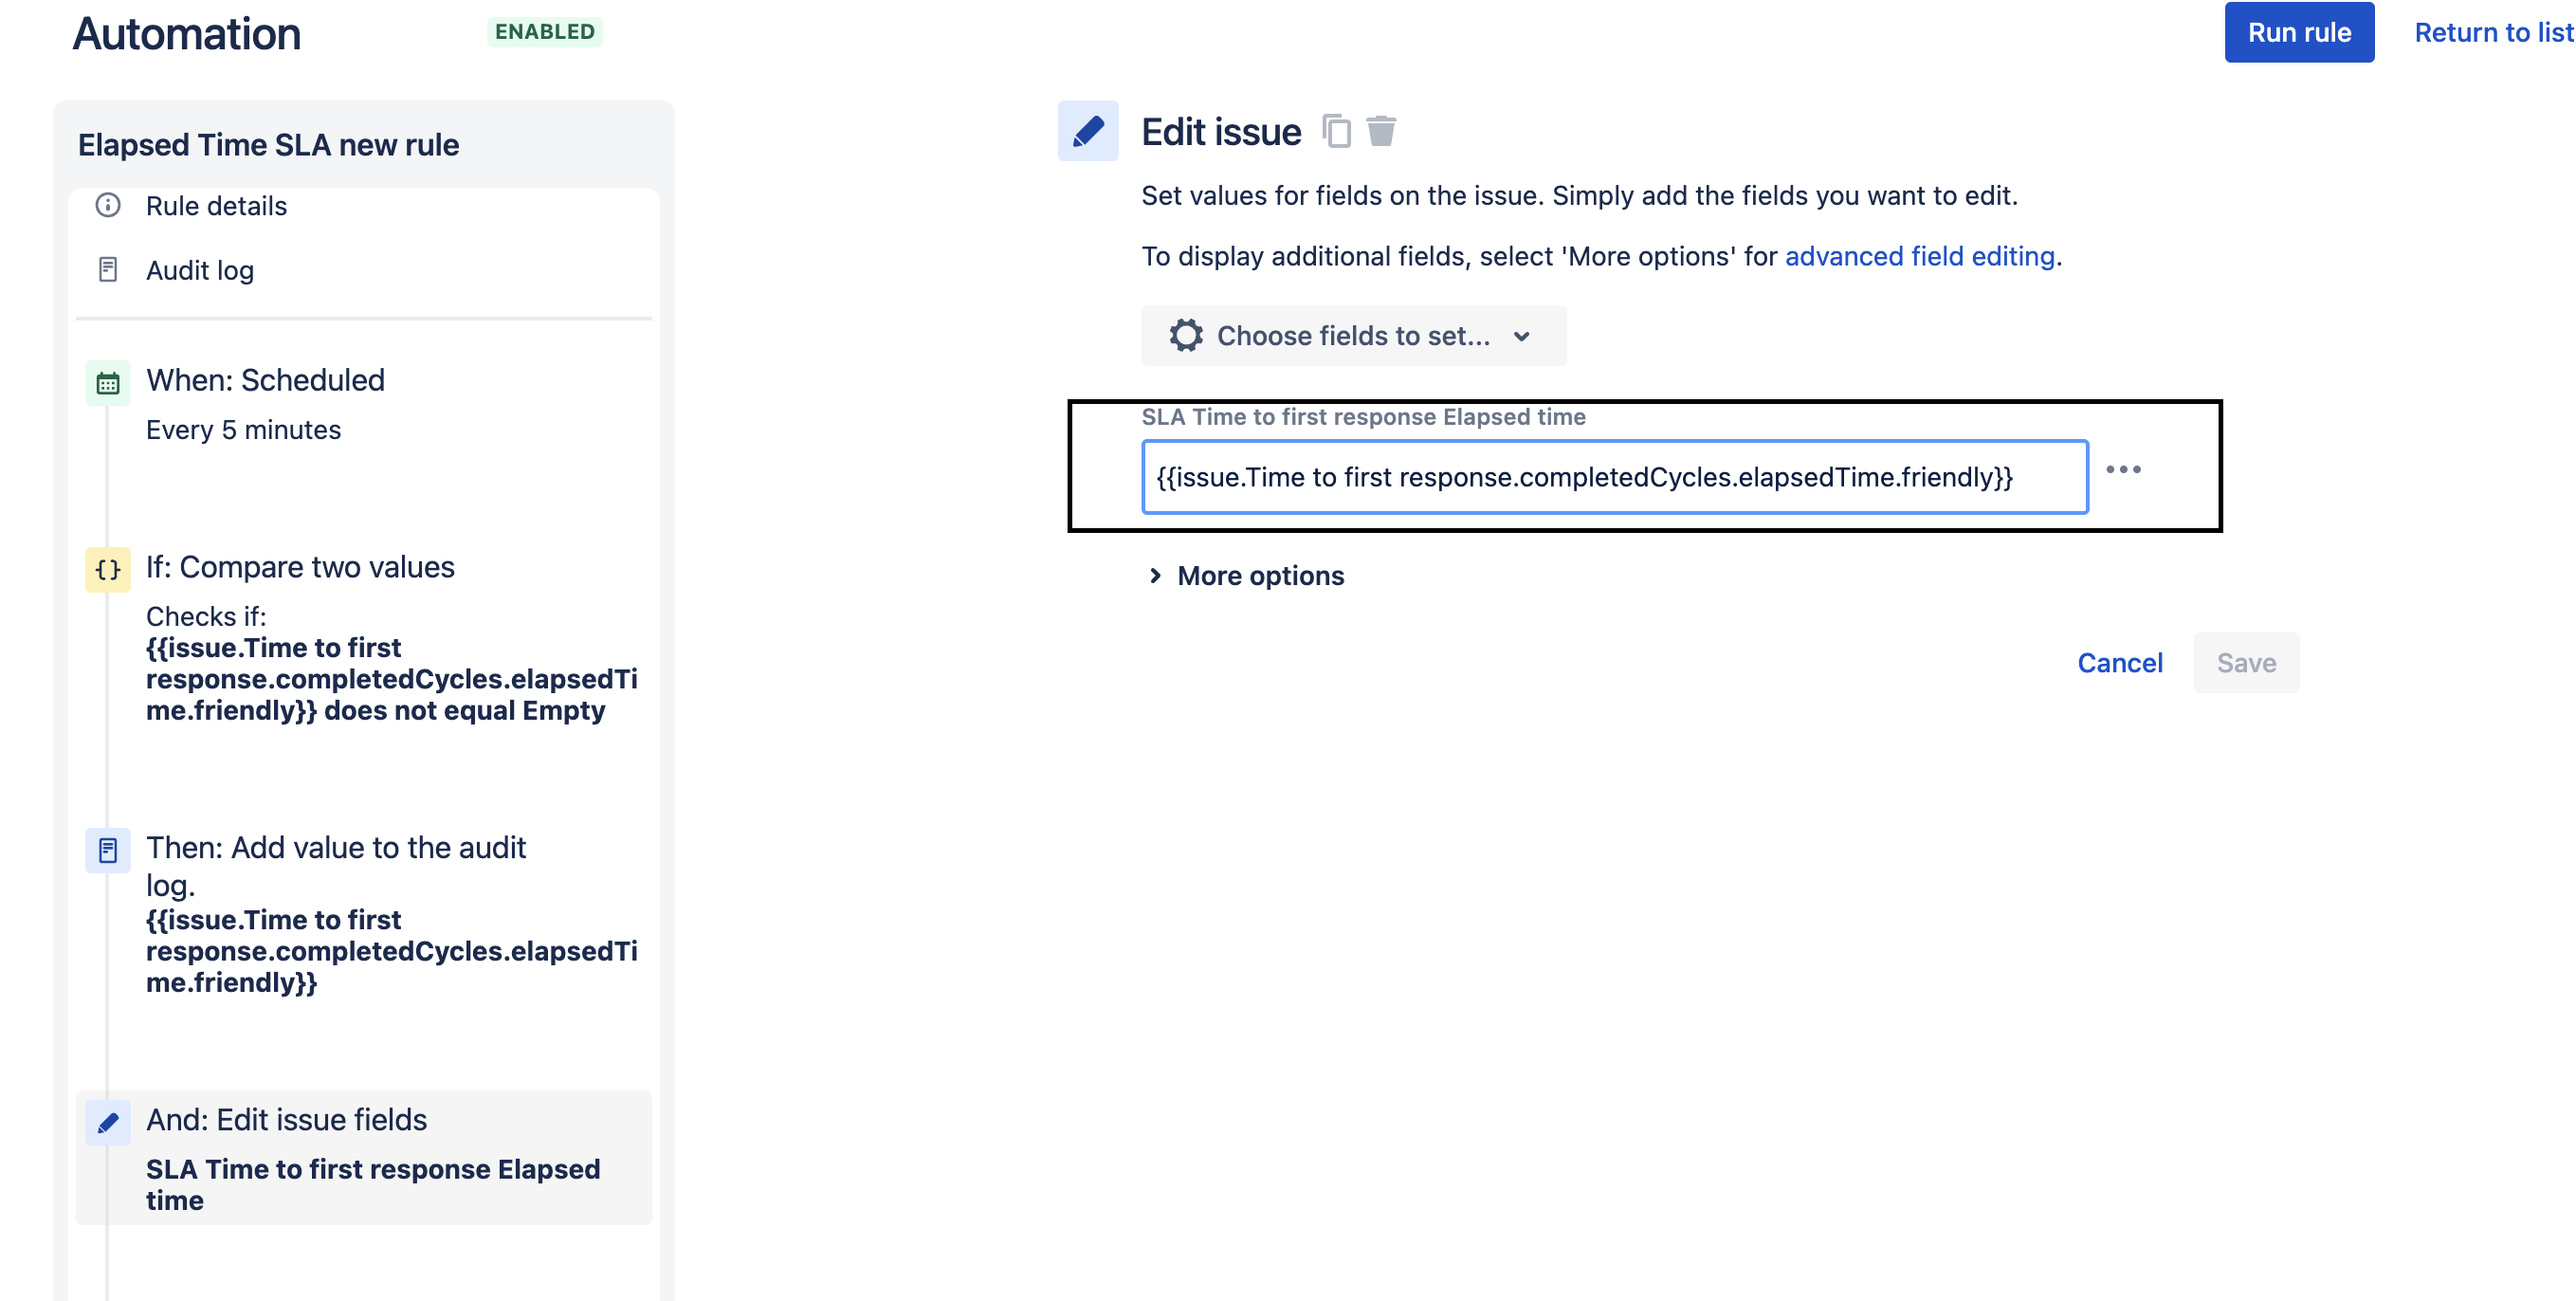
4. Save and publish the rule.
Verify it worked
Run the scheduled rule (or wait for its scheduled run), then open a ticket with a completed SLA cycle and confirm that the text field now shows the elapsed time.
Export the queue to CSV and confirm the elapsed-time column is populated.
Related article
Was this helpful?