Database monitoring page of Jira not showing any data
Platform Notice: Data Center Only - This article only applies to Atlassian apps on the Data Center platform.
Note that this KB was created for the Data Center version of the product. Data Center KBs for non-Data-Center-specific features may also work for Server versions of the product, however they have not been tested. Support for Server* products ended on February 15th 2024. If you are running a Server product, you can visit the Atlassian Server end of support announcement to review your migration options.
*Except Fisheye and Crucible
Summary
DB monitoring page does not contain any data or is blank.
Environment
8.20.11
9.7.0
9.17.1
Diagnosis
When opening the Monitoring database connection usage page, the graphs are empty:
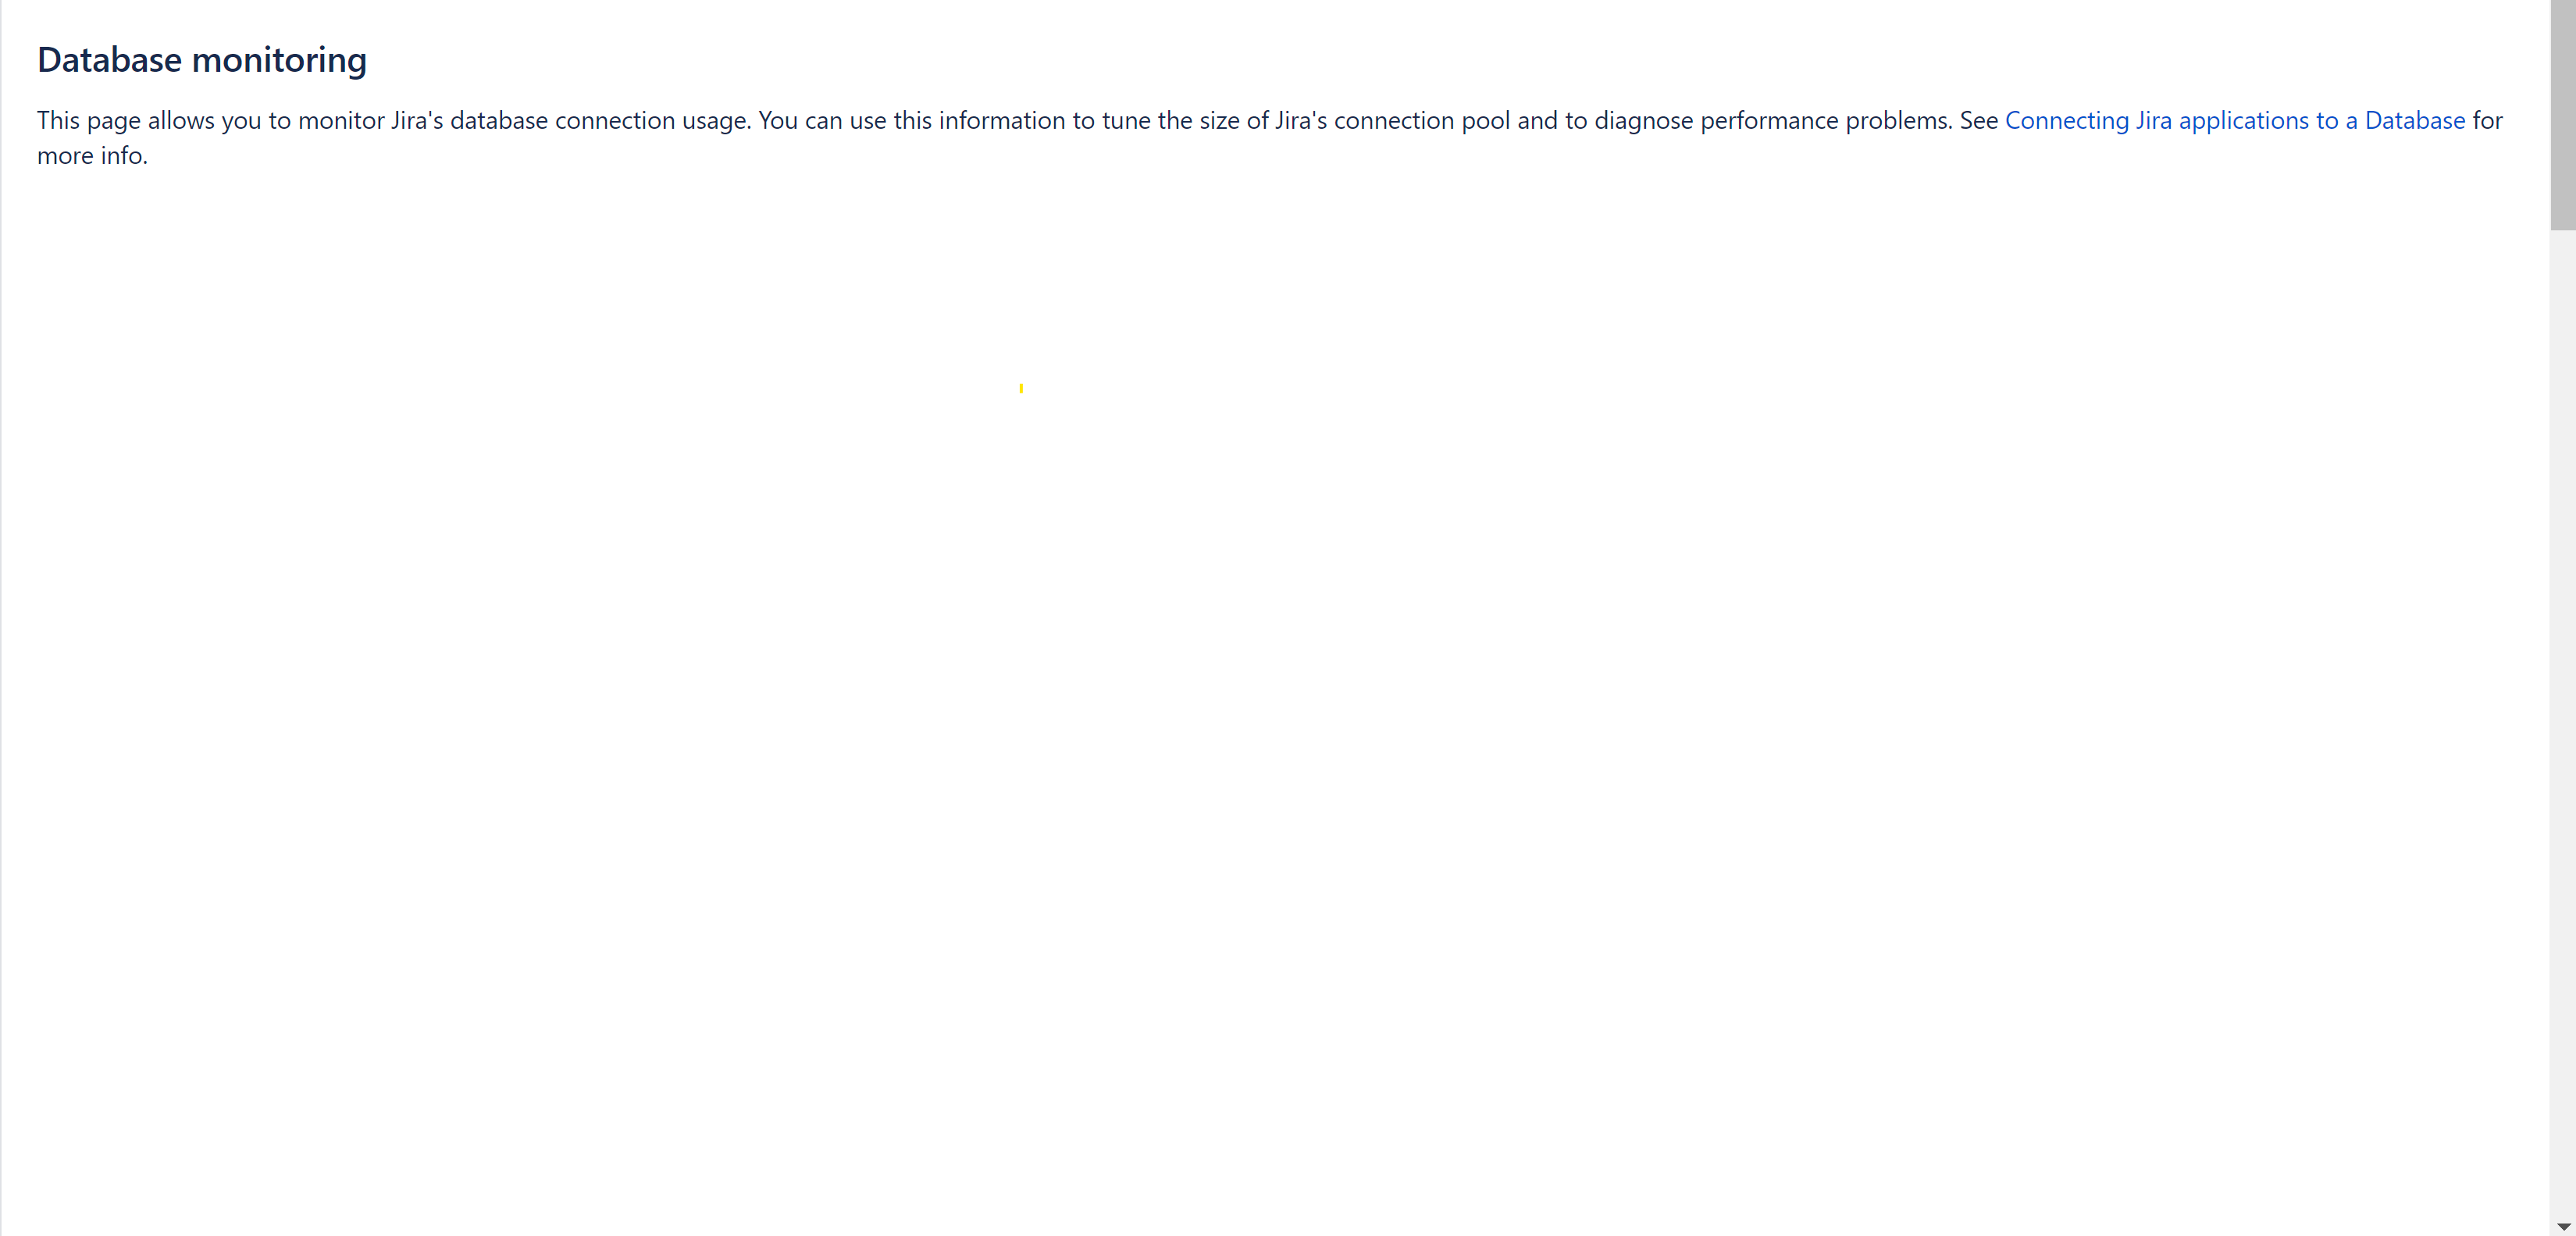
Jira uses rrd4j for DB monitoring; if there is a problem with the files or permissions, the above issue arises.
Solution
Make sure Jira has proper access to the .rrd4j files located under /$JIRA_HOME/monitor directory
ℹ️ If permission is properly set, it is possible the files are damaged. To resolve this, rename the files and restart Jira.
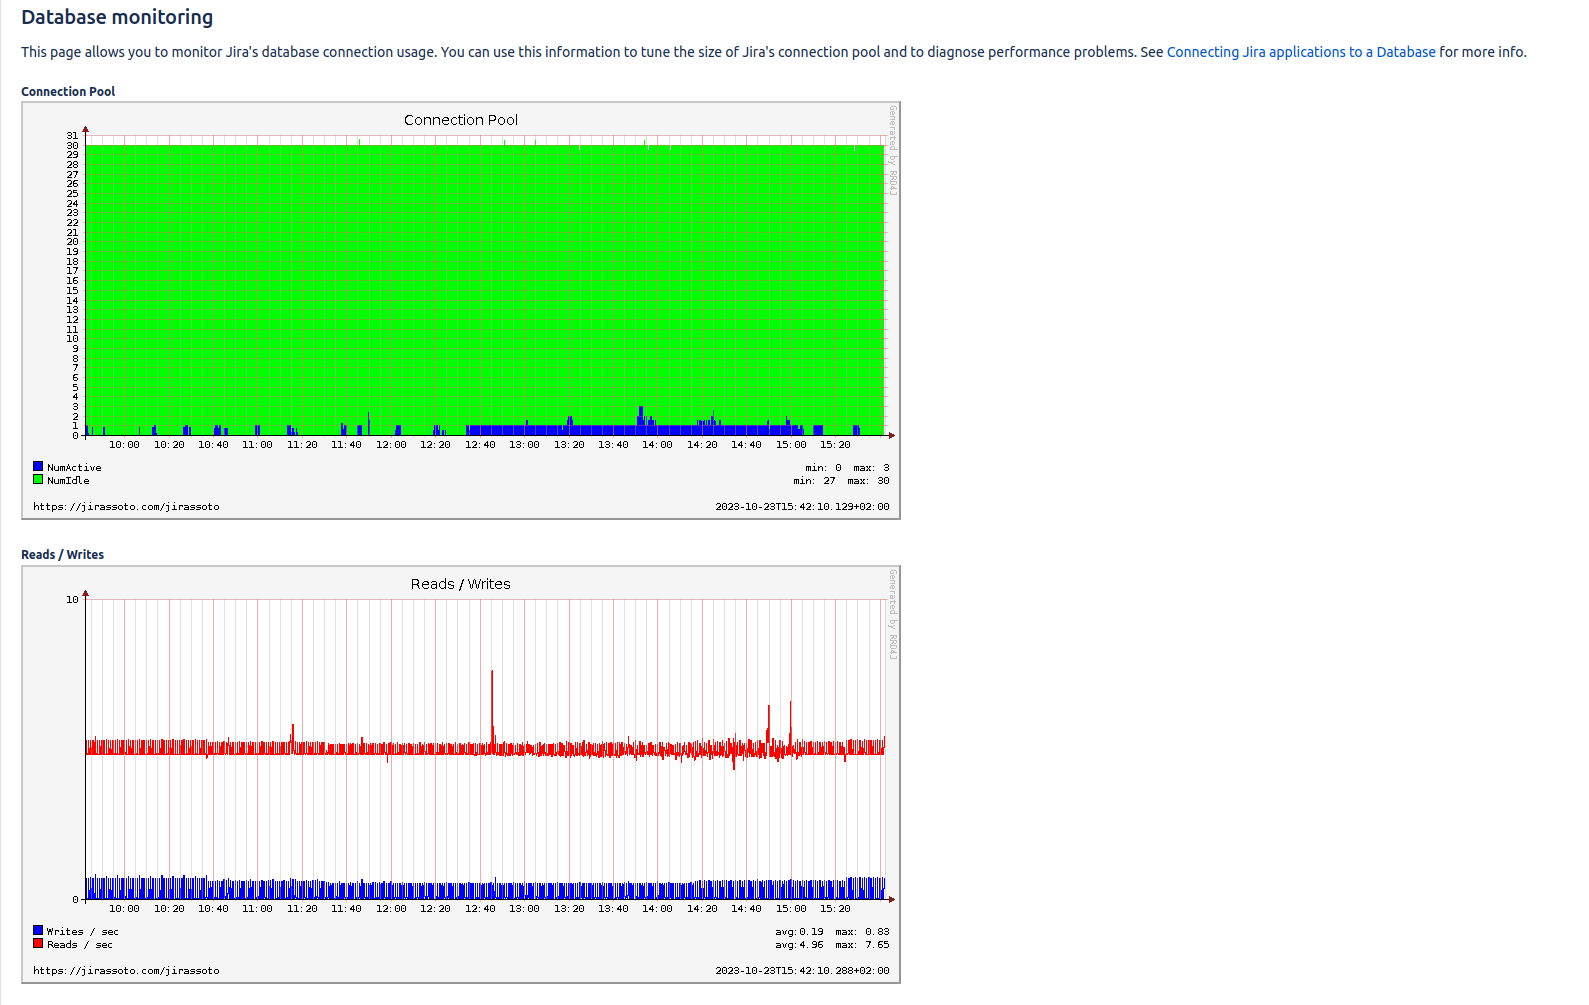
New files will be created and the information should appear properly:
Was this helpful?