Cluster Cache Replication HealthCheck fails due to unable to complete within the timeout
Platform Notice: Data Center Only - This article only applies to Atlassian apps on the Data Center platform.
Note that this KB was created for the Data Center version of the product. Data Center KBs for non-Data-Center-specific features may also work for Server versions of the product, however they have not been tested. Support for Server* products ended on February 15th 2024. If you are running a Server product, you can visit the Atlassian Server end of support announcement to review your migration options.
*Except Fisheye and Crucible
Problem
Jira Data Center cluster replication relies on nodes being recorded in a database and also receiving and sending updates. The Cluster Cache Replication Health Check confirms that replication is working across the entire cluster. If an active node is not responding, the other nodes are going to report warnings, and the one with the error will report a critical result. See for more details: Cluster Cache Replication health check fails in Jira Data Center
In some cases, due to the long time required to execute the Health Check, it might fail with the following error: The health check was unable to complete within the timeout of 20000
Screenshot:
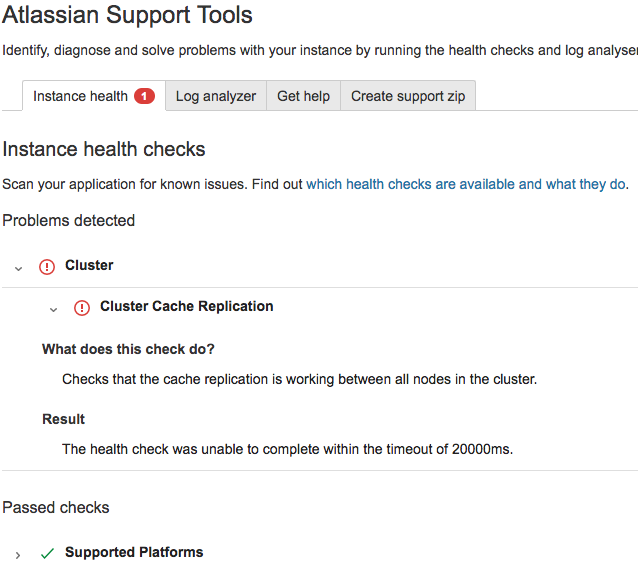
The following errors appear in the atlassian-jira.log:
2018-02-12 05:47:56,248  WARN  HealthCheckWatchdog:thread-6  ServiceRunner          [support.healthcheck.concurrent.SupportHealthCheckTask]  Health check Cluster Cache Replication was unable to complete within the timeout of 20000.
2018-02-12 05:47:56,249  ERROR  HealthCheck:thread-3  ServiceRunner          [plugins.healthcheck.service.ClusterHeartbeatService]  Failed to wait until cluster node appear in the cache
java.lang.InterruptedException: sleep interrupted
	at java.lang.Thread.sleep(Native Method) [?:1.8.0_102]
	at com.atlassian.jira.plugins.healthcheck.service.SleepTimeoutFactory$SleepTimeout.sleep(SleepTimeoutFactory.java:32) [?:?]
	at com.atlassian.jira.plugins.healthcheck.service.ClusterHeartbeatService.getClusterNodesReplicationInfo(ClusterHeartbeatService.java:71) [?:?]
	at com.atlassian.jira.plugins.healthcheck.cluster.ClusterReplicationHealthCheck.doCheck(ClusterReplicationHealthCheck.java:41) [?:?]
	at com.atlassian.jira.plugins.healthcheck.cluster.AbstractClusterHealthCheck.check(AbstractClusterHealthCheck.java:52) [?:?]
	at com.atlassian.support.healthcheck.impl.PluginSuppliedSupportHealthCheck.check(PluginSuppliedSupportHealthCheck.java:51) [?:?]
	at java.util.concurrent.FutureTask.run(FutureTask.java:266) [?:1.8.0_102]
	at java.util.concurrent.ThreadPoolExecutor.runWorker(ThreadPoolExecutor.java:1142) [?:1.8.0_102]
	at java.util.concurrent.ThreadPoolExecutor$Worker.run(ThreadPoolExecutor.java:617) [?:1.8.0_102]
	at java.lang.Thread.run(Thread.java:745) [?:1.8.0_102]
2018-02-12 05:47:56,278  WARN  HealthCheck:thread-3  ServiceRunner          [plugins.healthcheck.cluster.ClusterReplicationHealthCheck]  Node jiranode-2 does not seem to replicate its cache
Please note, this is a different problem than when the cluster is not properly configured and The node is not replicating due to a network condition. See: Cluster Cache Replication health check fails in Jira Data Center
Diagnosis
Environment
Jira Datacenter
A large number of scheduled threads
Cause 1 (pre Jira 7.4.2)
In Jira 7.4.2 and lower, we use the Jira Instance Health (JIH) plugin, which has a timeout of 20s set for the check run, while the check itself has a 60s timeout. We replaced JIH in Jira 7.4.3 with the Atlassian Troubleshooting & Support Tools Plugin (ATST). The bug is fixed in ATST 1.6.1, as it increases the timeout for the check, and also the later version of Jira has a different way of sending heartbeats that the check verifies.
Workaround
Add the below JVM argument as per Setting properties and options on startup:
-Datlassian.healthcheck.timeout-ms=60000If this doesn't resolve it, you may be affected by one of the additional causes below.
Cause 2
An underlying cause is that some or all nodes don't schedule cluster replication heartbeat due to a busy scheduler (Caesium), so the health check can't check the value within the timeout. The scheduler has a limited number of threads, which can cause contention for the check, as it may wait for an available thread, a wait that takes longer than 20s (or 60s after increasing it).
Health check for cluster replication uses its own cache to store nodeID.
Each node periodically puts a heartbeat value into that cache; this is done by a thread scheduled by the scheduler. Example of scheduled task HealthCheckSchedulerImpl triggered during start-up:
2017-03-31 13:12:15,241 localhost-startStop-1 INFO [c.a.j.p.h.scheduler.impl.HealthCheckSchedulerImpl] Scheduling job with : JobConfig[jobRunnerKey=com.atlassian.jira.plugins.healthcheck.scheduler.impl.HealthCheckSchedulerImpl,runMode=RUN_LOCALLY,schedule=Schedule[type=INTERVAL,intervalScheduleInfo=IntervalScheduleInfo[firstRunTime=Fri Mar 31 13:12:30 CEST 2017,intervalInMillis=10000]],parameters={}]Then, during the execution of the Healthcheck, it verifies the status:
It tries to check all non-replicating nodes (checking staus isReplicating from cache) and waits for heart-beat for each live node.
Normally, when the heartbeat thread runs periodically, data will be in cache, so it can reply immediately.
In current case, it waits in loop until it gets interrupted after 20000ms as per the above error.
Workaround
Unfortunately, there is no reliable workaround to this problem:
You can try running the Health Check during off-peak hours, which might reduce contention on the scheduler.
Reduce the number of scheduled jobs (e.g., if you have a high number of Mail Handlers) or space them throughout the day.
Resolution
Unfortunately, there is no resolution. The best way will be to increase the number of scheduler threads, but this value is hardcoded and set to 4. See JRASERVER-65809 - As a Jira Administrator I want to configure number of scheduler threads.
Cause 3
There is a trailing white space on the node's ID, and Jira doesn't handle this consistently: the value is read from the cluster.properties file with the trailing space and saved to the database's clusternode table. However, it seems that the health check mechanism trims trailing whitespace, which results in the node not being found. We have raised JRASERVER-67243 - As an JIRA Datacenter Administrator I want to trim all spaces in the cluster.properties file to address that.
Workaround #1
Rename the node to a unique name (for example, appending 1 or etc.) in the cluster.properties file.
Make sure there is no trailing space in here either.
Workaround #2
Make sure the
jira.node.idproperty has no trailing space in its value on thecluster.propertiesfile;Ensure the
NODE_IDcolumn of theclusternodedatabase table has no trailing space after the value;Ensure the
NODE_IDcolumn of theclusternodeheartbeatdatabase table has no trailing space after the value.
Cause 4
Java arg -Djava.rmi.server.hostname= is set to the wrong server hostname. RMI is used for EHCache, so wrong settings there affect the configuration and replication workflow.
Resolution
Check Java arg -Djava.rmi.server.hostname= and either remove it (if not required) or ensure it's set to the proper value.
Was this helpful?