Jira Cloud automation triggers are significantly delayed
Platform Notice: Cloud Only - This article only applies to Atlassian apps on the cloud platform.
Summary
On some occasions, automation will take an hour or more to execute a trigger. This results in any rule actions firing on a huge delay, potentially causing inaccurate or unwanted actions to fire on work matching the automation conditional blocks. This may also appear as if the rule was triggered without any apparent reason.
Diagnosis
Some Jira instances have large lists of automations that run multiple times within short periods of time. In normal circumstances, automation can keep up with a large number of automation executions in parallel without having a performance impact. However, there may be certain scenarios where multiple automations are running with thousands of parallel processes. This can result in degraded performance due to the high load. Automation uses a rule processing queue to manage the execution of rules in your instance. To maintain performance, rule executions are queued, and the number of items processed in parallel is limited.
Cause
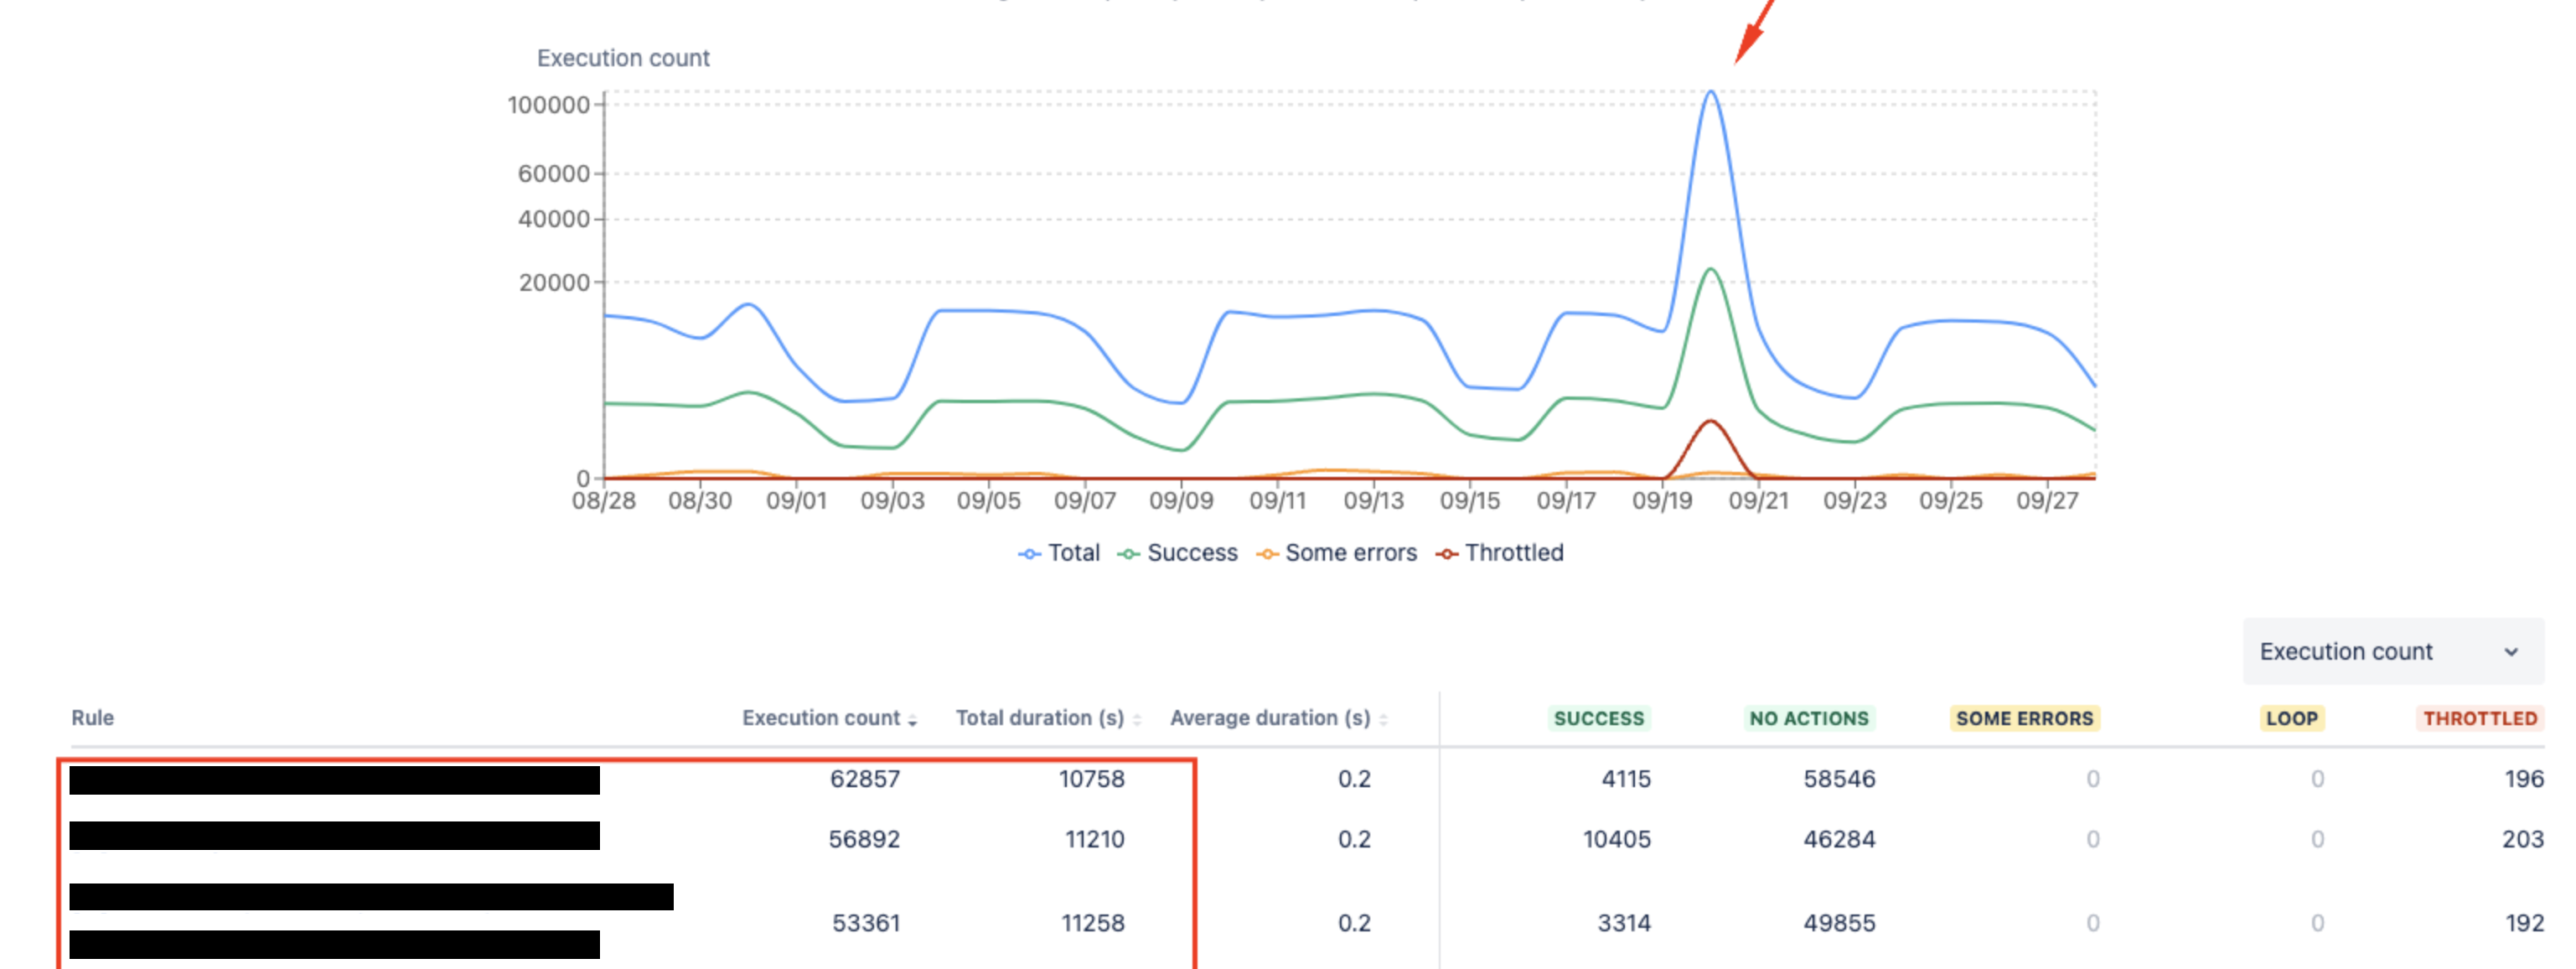
A large spike of automation executions can be seen under the Global automation performance insights page:
https://<instanceName>.atlassian.net/jira/settings/automation#/performance-insights
Large automation spikes can be caused by:
Enabling an automation that runs on a large number of work items
Scheduled rules are the most common example
Restoring an archived project that has a large number of work items and automation triggering against those
Automation rules that are configured for looped "send web requests" actions
Running bulk imports, especially for automations triggered by creating or updating work items
The spike will be shown in the performance-insights graph. Try filtering on the day the delay was seen, and you'll see the spike in activity along with the rules that were executed during that timeframe. Here's an example graph:
Solution
Optimize Jira automation rules for performance
This behavior is considered to be very uncommon and it should be attributed to isolated cases where huge volume of rules are being executed in parallel resulting on delays for certain issues where automation is running towards.
If you regularly experience behavior like this, consider auditing your automation rules and optimizing them for performance.
If you need to perform bulk updates through automation, consider running them outside of peak Jira usage hours. This will lessen any impact on real users if usage spikes do occur.
If you're facing recurrent delays due to automation spikes, or if you're experiencing delays not matching what's documented here, please contact Atlassian Support for assistance.
Additional documentation
Was this helpful?