A Jira node takes several hours to startup due to the index snapshot catchup process
Platform Notice: Data Center Only - This article only applies to Atlassian apps on the Data Center platform.
Note that this KB was created for the Data Center version of the product. Data Center KBs for non-Data-Center-specific features may also work for Server versions of the product, however they have not been tested. Support for Server* products ended on February 15th 2024. If you are running a Server product, you can visit the Atlassian Server end of support announcement to review your migration options.
*Except Fisheye and Crucible
Summary
The purpose of this article is to describe a scenario where one (or several) Jira node(s) in a Data Center cluster takes a few hours to startup due to the index snapshot catch up process.
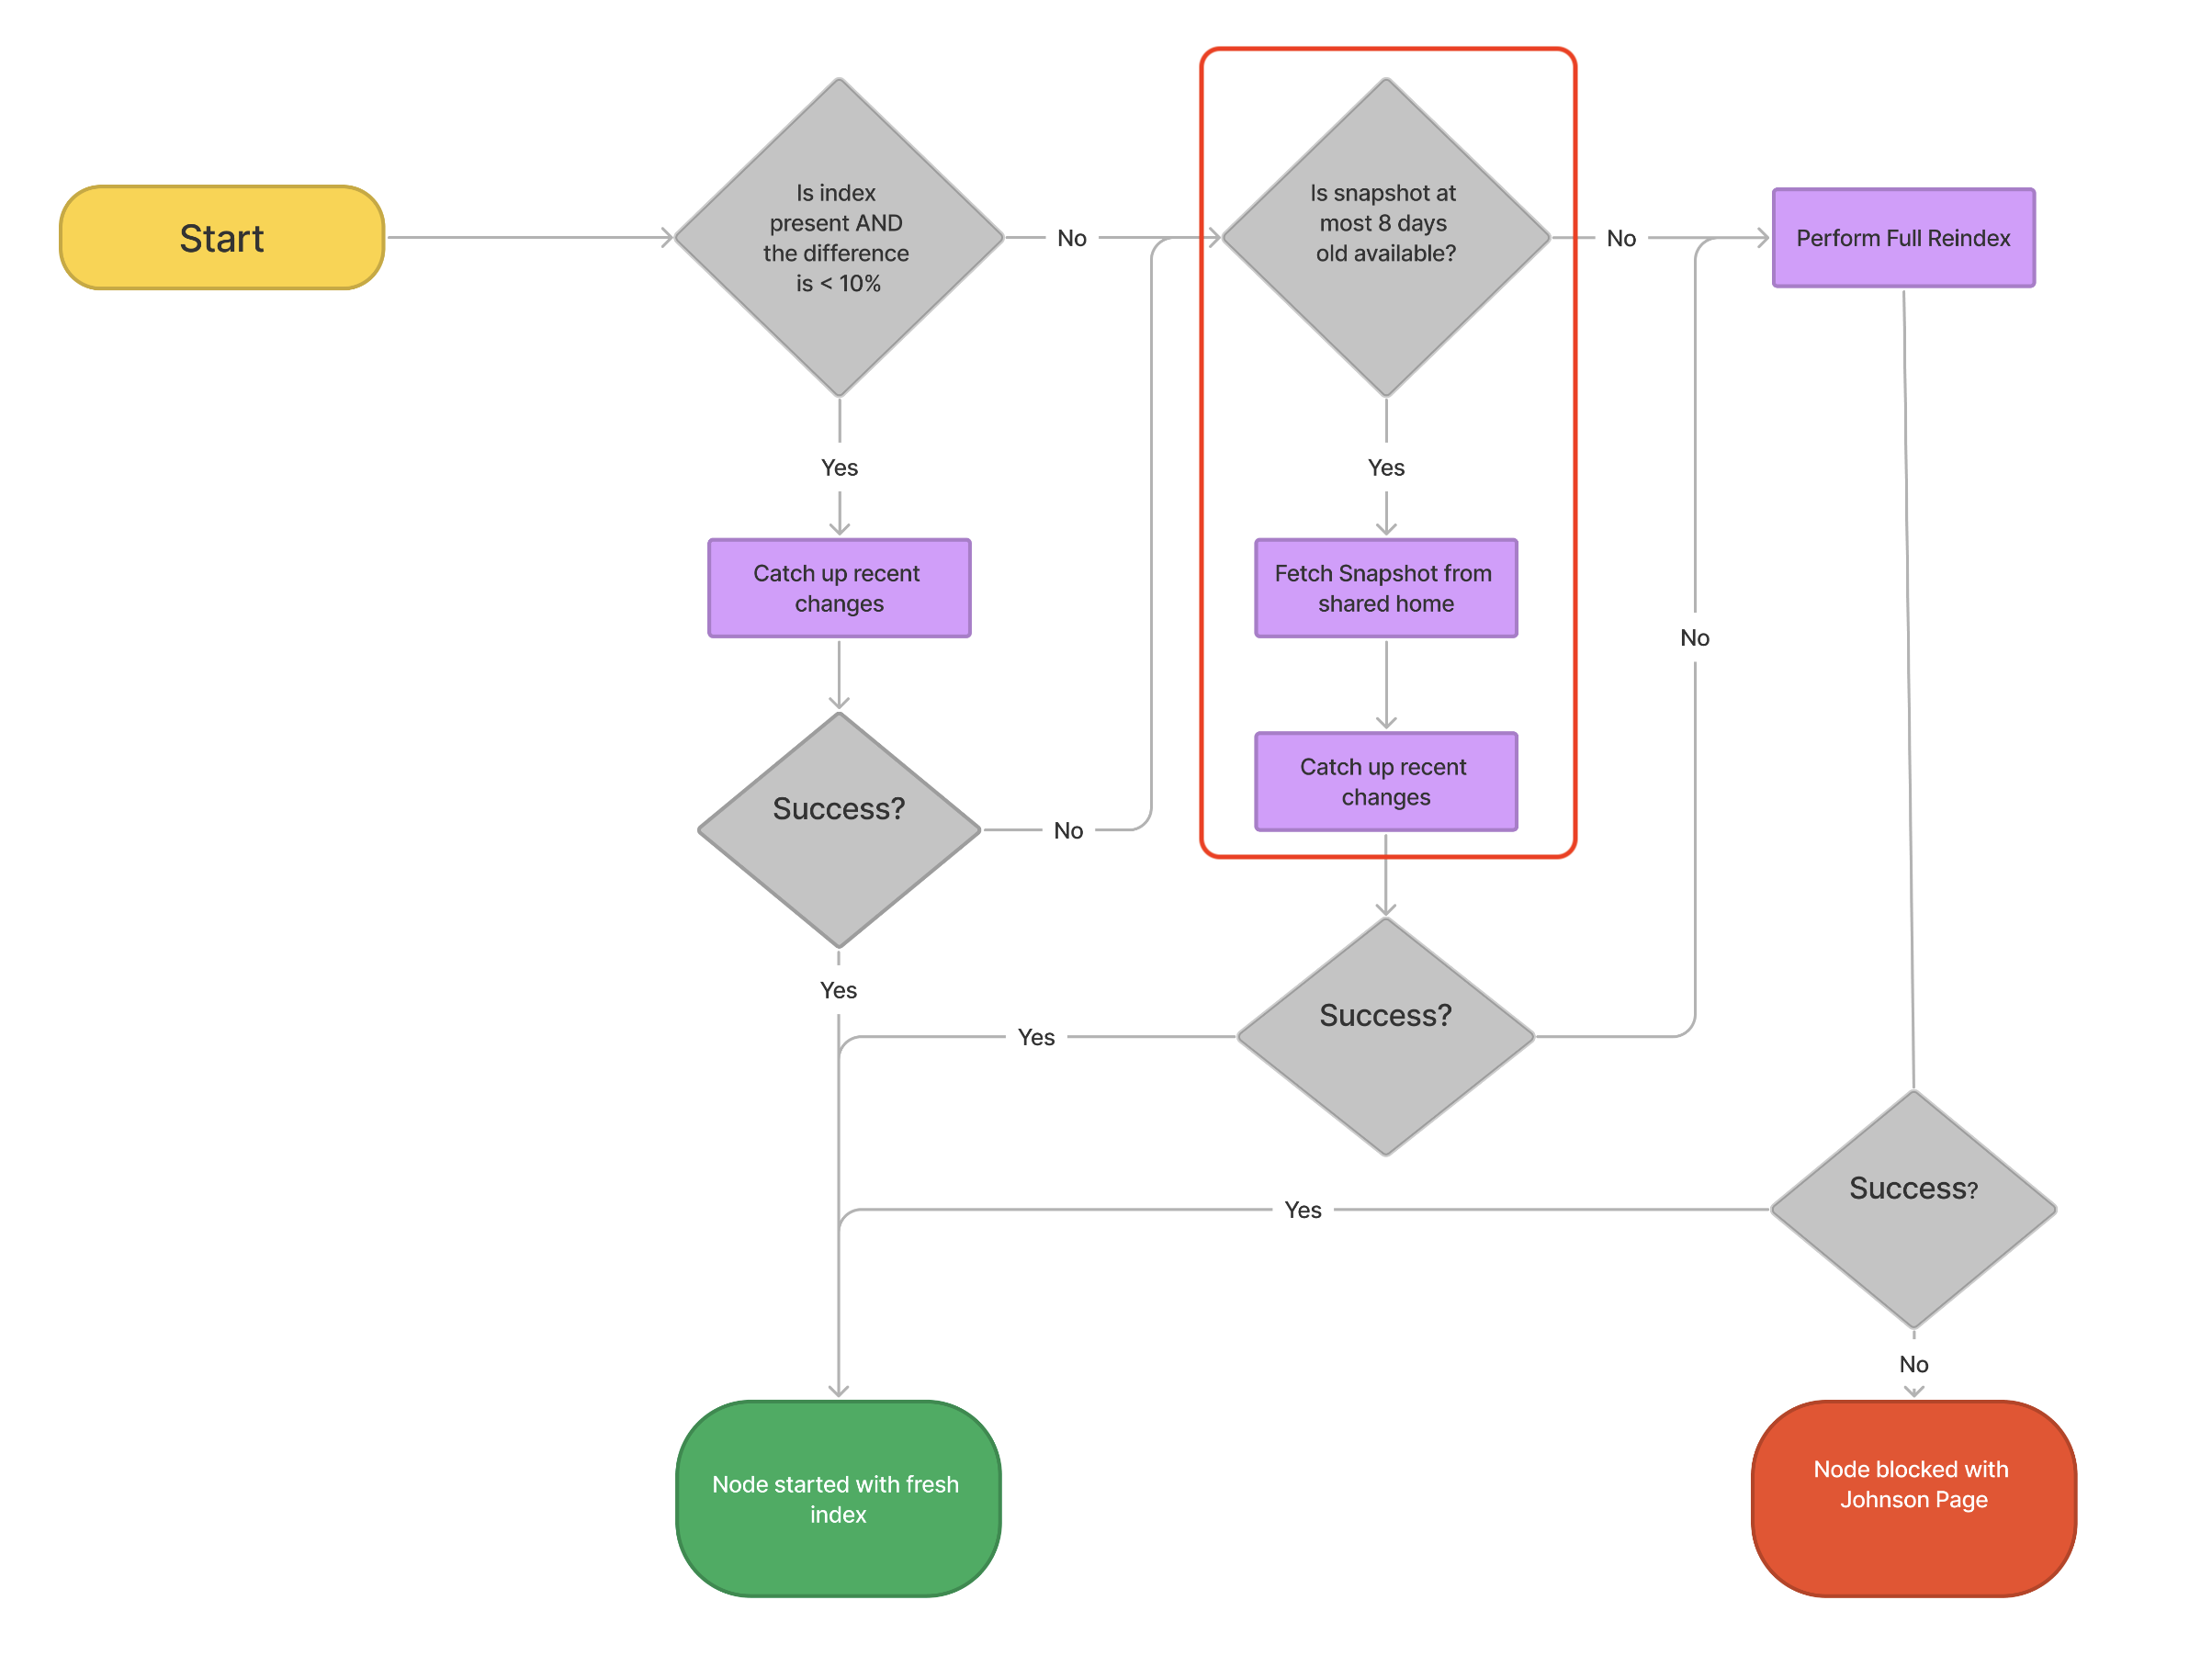
The index snapshot catch up process is illustrated in the diagram below which is taken from the article Index startup procedure in Jira 9.4 and later:
ℹ️ Note that there can be many situations where a Jira node takes a long time to start. This article will focus on one specific scenario that causes the slow startup of a Jira node.
Environment
Jira Data Center on any version from 9.0.0, and using a cluster of nodes.
Diagnosis
The Jira application was recently upgraded from 8.x to 9.x by following by adding the 2 JVM parameters listed below as suggested in any of the documentation Practical guide on upgrading Jira Data Center to version 9 and LTS or Upgrading Jira Data Center to 9.4 and these parameters were not removed after the upgrade:
-Dcom.atlassian.jira.startup.allow.full.reindex=false
-Dcom.atlassian.jira.startup.rebuild.local.index=false
The Jira logs are showing that during the startup, the node is restoring the indexes from the Index snapshot located in the shared home folder, and that it is taking a very long time (1h in the example of logs below) to perform the snapshot catch up process:
2024-04-09 14:35:09,488+0200 main INFO      [c.a.j.index.ha.DefaultIndexRecoveryManager] [INDEX-FIXER] Restoring search indexes from snapshot and catching up with changes - 1% complete... Starting
2024-04-09 14:35:09,488+0200 main INFO      [c.a.j.index.ha.DefaultIndexRecoveryManager] [INDEX-FIXER] Starting the index recovery process by replacing existing indexes. For the whole time of recovering the index (restoring and catch up) we will be holding the index write lock


—————————
2024-04-09 14:35:10,341+0200 main INFO      [c.a.j.index.ha.DefaultIndexRecoveryManager] [INDEX-FIXER] Restoring search indexes - 30% complete... Restored index backup
————————-
2024-04-09 15:32:19,505+0200 main INFO      [c.a.j.index.ha.DefaultIndexRecoveryManager] [INDEX-FIXER] Recovering - 100% complete... Recovered all indexes
2024-04-09 15:32:19,508+0200 main INFO      [c.a.jira.cluster.DefaultClusterManager] Current node: i-0eb5f0892e1577818. Done recovering indexes from the snapshot found in shared home.
When Capturing Thread dumps during the Jira node startup, we should see a long running thread showing that the Jira node is trying to catch up with the most recent changes in the database after loading the index snapshot:
java.net.SocketInputStream.socketRead0(java.base@11.0.22/Native Method)
java.net.SocketInputStream.socketRead(java.base@11.0.22/SocketInputStream.java:115)
java.net.SocketInputStream.read(java.base@11.0.22/SocketInputStream.java:168)
java.net.SocketInputStream.read(java.base@11.0.22/SocketInputStream.java:140)
sun.security.ssl.SSLSocketInputRecord.read(java.base@11.0.22/SSLSocketInputRecord.java:484)
sun.security.ssl.SSLSocketInputRecord.readHeader(java.base@11.0.22/SSLSocketInputRecord.java:478)
sun.security.ssl.SSLSocketInputRecord.bytesInCompletePacket(java.base@11.0.22/SSLSocketInputRecord.java:70)
sun.security.ssl.SSLSocketImpl.readApplicationRecord(java.base@11.0.22/SSLSocketImpl.java:1459)
sun.security.ssl.SSLSocketImpl$AppInputStream.read(java.base@11.0.22/SSLSocketImpl.java:1070)
org.postgresql.core.VisibleBufferedInputStream.readMore(VisibleBufferedInputStream.java:161)
---------------
---------------
com.sun.proxy.$Proxy102.withReindexLock(Unknown Source)
com.atlassian.jira.index.ha.DefaultIndexRecoveryManager.recoverIndexFromBackup(DefaultIndexRecoveryManager.java:171)
com.atlassian.jira.index.ha.DefaultIndexRecoveryManager.safeRecoverIndexFromBackup(DefaultIndexRecoveryManager.java:138)
com.atlassian.jira.index.DefaultIndexFetcher.recoverIndexFromMostRecentSnapshot(DefaultIndexFetcher.java:108)
com.atlassian.jira.cluster.DefaultClusterManager.pickIndexSnapshotFromSharedHome(DefaultClusterManager.java:442)
com.atlassian.jira.cluster.DefaultClusterManager.checkIndexOnStart(DefaultClusterManager.java:224)
com.atlassian.jira.startup.ClusteringLauncher.clusterSynchronizedCheckIndex(ClusteringLauncher.java:99)
com.atlassian.jira.startup.ClusteringLauncher.start(ClusteringLauncher.java:130)
com.atlassian.jira.startup.DefaultJiraLauncher.postDBActivated(DefaultJiraLauncher.java:173)
com.atlassian.jira.startup.DefaultJiraLauncher.lambda$postDbLaunch$2(DefaultJiraLauncher.java:150)
Cause
The slow startup time of the Jira node is a combination of multiple factors:
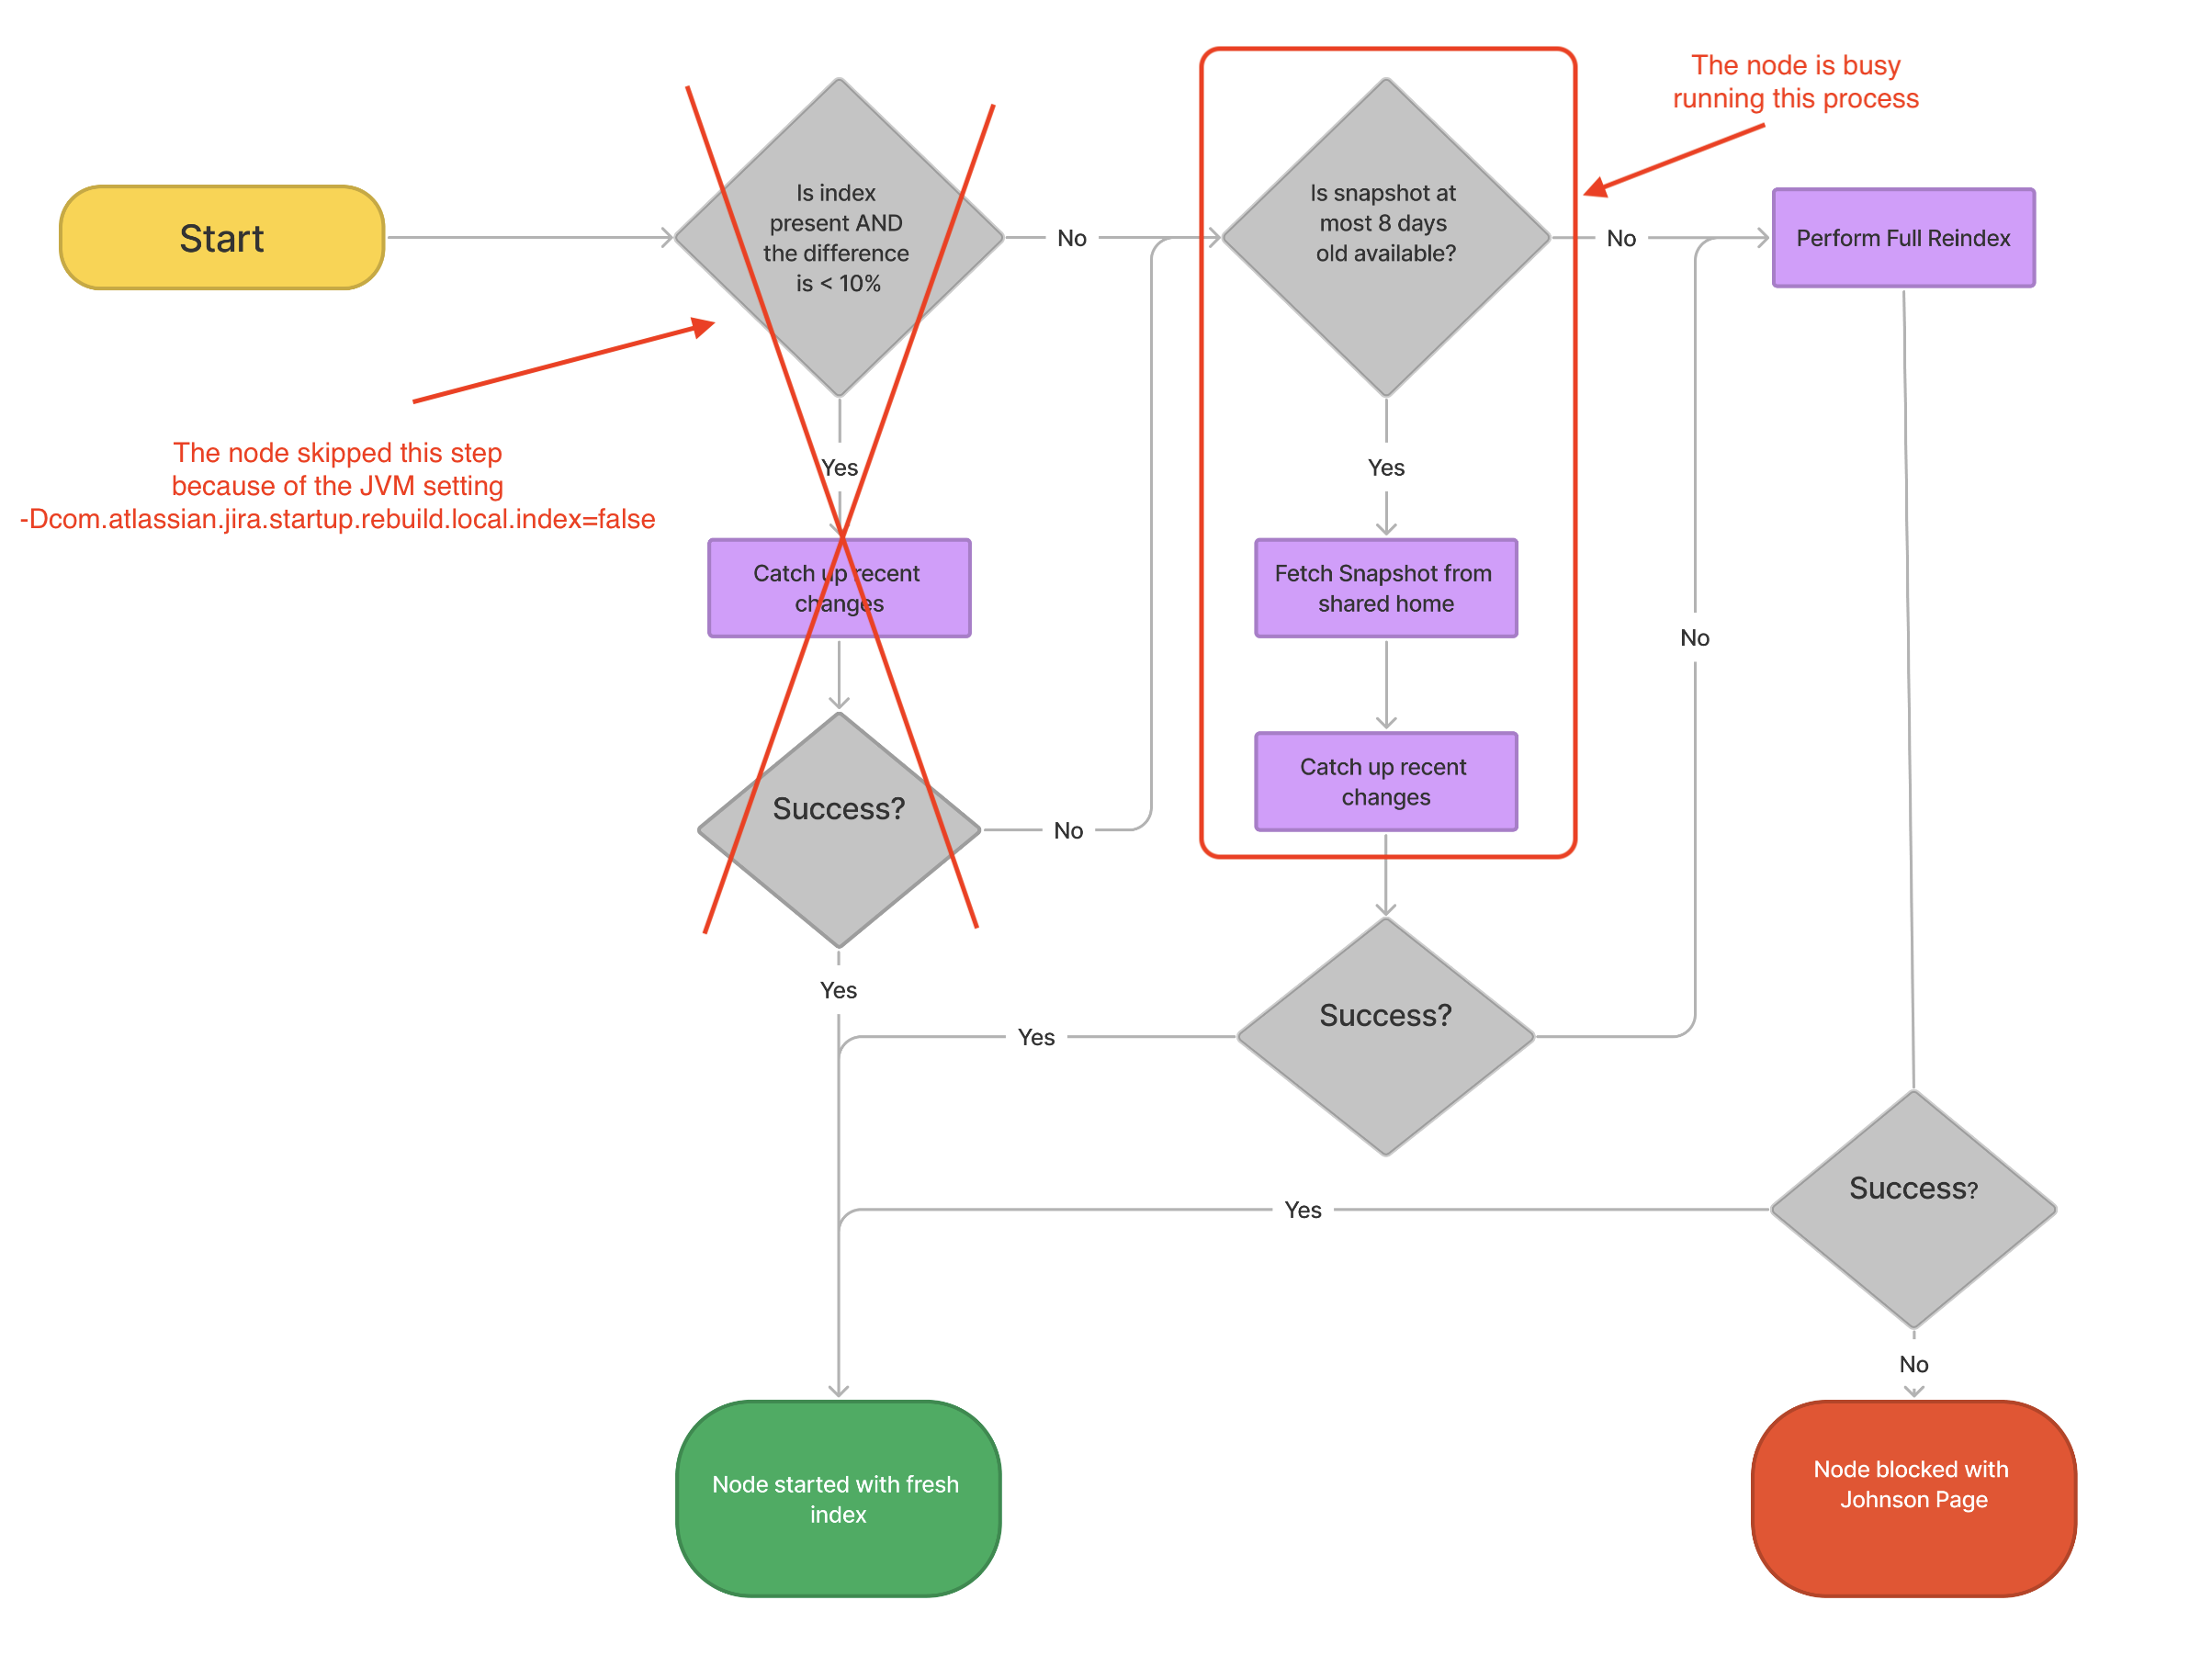
The JVM parameter below was not removed after the Jira upgrade to 9.x was completed, as instructed in the documentation Practical guide on upgrading Jira Data Center to version 9 and LTS. As explained in the article Failed getting index on start, this JVM parameter prevents the Jira node from loading its own local index during the startup:
-Dcom.atlassian.jira.startup.rebuild.local.index=falseBecause of that JVM parameter, the Jira node ignores its own local index and tries to load the index snapshot from the shared home folder, and tries to catch up with recent events:
If the index snapshot is not up to date and a lot of Jira issue activity has happened between the moment the snapshot was updated and the node was started. Because of that, the Jira node needs to spend a lot of time catching up with all the recent events that need to be fetched from the Jira Database. Depending on how quickly the Database can be accessed, and how behind the index snapshot is, this process can end up taking a long time (several hours)
New index snapshots will only be created upon specific event/actions such as (but not limited to):
periodically via a scheduled Job
via the Jira UI, by using the Full re-index option on the page ⚙ > System > Indexing
via the Jira UI, by using the Create index snapshot option on the page ⚙ > System > Indexing
As long as the most recent index snapshot is "old", whenever the Jira node is restarted, it will spend over and over the same amount of time, trying to catch up with the most recent events from the Jira database.
Solution
Remove the 2 JVM properties below as instructed in the documentation Practical guide on upgrading Jira Data Center to version 9 and LTS
-Dcom.atlassian.jira.startup.allow.full.reindex=false
-Dcom.atlassian.jira.startup.rebuild.local.index=false
ℹ️ Note that the JVM parameter that actually caused this issue in the first place is
-Dcom.atlassian.jira.startup.rebuild.local.index=false. However we also recommend removing the JVM parameter-Dcom.atlassian.jira.startup.allow.full.reindex=false, so that the Jira node can work as expected on all subsequent restarts
Re-start the Jira node for this change to take effect, and wait until the Jira node startup is complete
ℹ️ This startup might still take some time, depending if the Node has a local index or not, and how old this index is
We also recommend checking if index snapshot recovery is enabled or not, follow Considerations for Jira index snapshots for more details. It should be enabled and interval should be set for everyday at 2:00 AM system time. This helps in quick index catch up from new snapshot.
Was this helpful?