How to monitor Jira performance with Apdex
プラットフォームについて: Data Center のみ。 - This article only applies to Atlassian apps on the Data Center プラットフォーム。
この KB は Data Center バージョンの製品用に作成されています。Data Center 固有ではない機能の Data Center KB は、製品のサーバー バージョンでも動作する可能性はありますが、テストは行われていません。 Server* 製品のサポートは 2024 年 2 月 15 日に終了しました。Server 製品を実行している場合は、 アトラシアン Server サポート終了 のお知らせにアクセスして、移行オプションを確認してください。
*Fisheye および Crucible は除く
要約
As an admin you can monitor your Jira server and Data Center performance by checking the Apdex metric. The metric is collected on hourly basis and displayed in the $JIRA_HOME/log/atlassian-jira-apdex.log log file. If you run Jira Data Center, the Apdex metric is calculated per node.
This is JIRA dark feature that is enabled by default. To disable it, add the dark feature jira.apdex.stats.disabled.
ソリューション
File format
The file has the following format:
Apdex file
2022-02-10 10:01:00,054+0100 category: overall, apdex: {apdexScore=25, satisfiedCount=0, toleratingCount=1, frustratedCount=1}
2022-02-10 10:01:00,055+0100 category: jira.gadgets.iframe.activity-stream, apdex: {apdexScore=50, satisfiedCount=0, toleratingCount=1, frustratedCount=0}
2022-02-10 10:01:00,055+0100 category: jira.dashboard, apdex: {apdexScore=0, satisfiedCount=0, toleratingCount=0, frustratedCount=1}
2022-02-10 12:01:00,272+0100 category: jira.header.menu.admin, apdex: {apdexScore=100, satisfiedCount=2, toleratingCount=0, frustratedCount=0}
2022-02-10 12:01:00,275+0100 category: jira.header.menu.profile, apdex: {apdexScore=100, satisfiedCount=3, toleratingCount=0, frustratedCount=0}
2022-02-10 12:01:00,275+0100 category: jira.dashboard, apdex: {apdexScore=72, satisfiedCount=4, toleratingCount=5, frustratedCount=0}
2022-02-10 12:01:00,275+0100 category: overall, apdex: {apdexScore=88, satisfiedCount=17, toleratingCount=5, frustratedCount=0}
2022-02-10 12:01:00,276+0100 category: jira.header.menu.dashboards, apdex: {apdexScore=100, satisfiedCount=1, toleratingCount=0, frustratedCount=0}
2022-02-10 12:01:00,276+0100 category: jira.gadgets.iframe.activity-stream, apdex: {apdexScore=100, satisfiedCount=7, toleratingCount=0, frustratedCount=0}
2022-02-10 14:01:00,003+0100 category: jira.header.menu.admin, apdex: {apdexScore=100, satisfiedCount=1, toleratingCount=0, frustratedCount=0}
2022-02-10 14:01:00,005+0100 category: overall, apdex: {apdexScore=83, satisfiedCount=2, toleratingCount=1, frustratedCount=0}
2022-02-10 14:01:00,005+0100 category: jira.gadgets.iframe.activity-stream, apdex: {apdexScore=100, satisfiedCount=1, toleratingCount=0, frustratedCount=0}
2022-02-10 14:01:00,006+0100 category: jira.dashboard, apdex: {apdexScore=50, satisfiedCount=0, toleratingCount=1, frustratedCount=0}
場所
2022-02-10 10:01:00,055+0100 - is the write timestamp
jira.dashboard - is the category
apdex score - has the values of 0-100
satisfiedCount/toleratingCount/frustratedCount - is the number of page views/loads.
The apdexScore will show -1 value if the satisfiedCount/toleratingCount/frustratedCount are zeroed.
File location and categories
The current Apdex metric can be accessed using REST API. For example, you can use the following calls
/rest/apdex/1/apdex?key=overall/rest/apdex/1/apdex?key=jira.dashboard
After a full hour the average metric is sent to the $JIRA_HOME/log/atlassian-jira-apdex.log log file. Each log file can have a maximum of 20 MB and we collect a maximum of 5 files before they get overwritten (from the oldest up). The log file lists all the available categories.
The following are the most popular categories that are available:
Selected Jira Core/Software Apdex categories:
鍵 (キー) | 名前 |
|---|---|
overall | All pages/interactions |
jira.dashboard | Jira ダッシュボード |
jira.project.issue.view-issue | プロジェクトの課題ビュー |
jira.issue.view | Full page issue view |
jira.issue.nav-detail | Issue navigator with issue details |
jira.agile.work | Agile board view |
jira.agile.work-detail | Agile board view with open issue |
jira.agile.plan | Agile backlog view |
jira.agile.plan-detail | Agile backlog view with open issue |
jira.issue.nav-list | Search list view |
しきい値
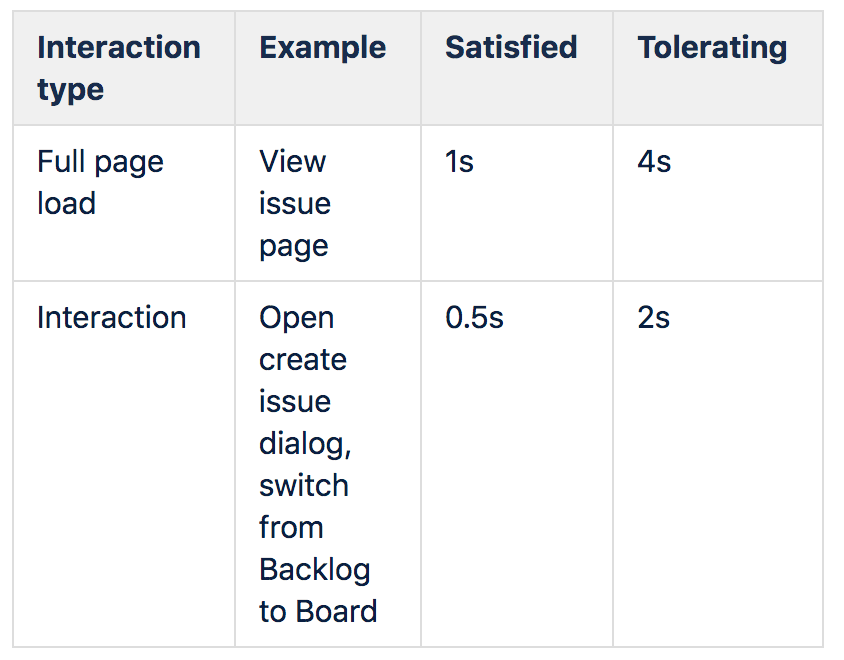
Generally, we use default thresholds where:
- full page load is <1s = 1 Apdex point, < 4s = 0.5 apdex
- partial page load (SPA) is <0.25s =1 point, <1s = 0.5 point
However some features might have custom thresholds. Also, the "ready" state might differ between pages and interactions. For example, the View issue page is considered as ready for user once the summary header is rendered.
To understand how the thresholds translate into scores, check its Wikipedia page or the full specification.
トラブルシューティング
Logs are not written?
It could be Jira doesn't have enough permissions to create or edit the file, you can check both KBs according to the platform Jira is installed:
It's also possible that the log4j properties file is not recording the correct permission level for the Apdex job, do check the following line and make sure INFO is set
Jira log4j file
...
log4j.logger.com.atlassian.jira.apdex.impl.SendAnalyticsJobRunner = INFO, apdexlog
...この内容はお役に立ちましたか?