Use CASE statements in a “Dropdown” control
プラットフォームの注記: Cloud のみ - This article only applies to Atlassian apps on the クラウド プラットフォーム上のアトラシアン製品にのみ適用されます。
要約
CASE statements use conditional logic to alter query results or to perform calculations on your query results. It’s a flexible SQL and SQLite expression that can be used anywhere a query is set in Atlassian Analytics. It can also be combined with other functions or formulas.
ソリューション
Add a CASE statement to a “Dropdown” control
"Dropdown" controls on dashboards are set up using data source queries. If results within your data source aren’t formatted how you’d like them to be displayed within your “ドロップダウン” control, you can edit your values using a CASE statement.
Let’s say we have a “Dropdown” control with different Jira project types from our Atlassian Data Lake data source. One of them is “service_desk”, and we want to create a CASE statement to have this visible as “service management” in our "Dropdown" control.
We’ll also need to put the CASE statement in our connected chart so they’re both using the value “service management” when filtering.
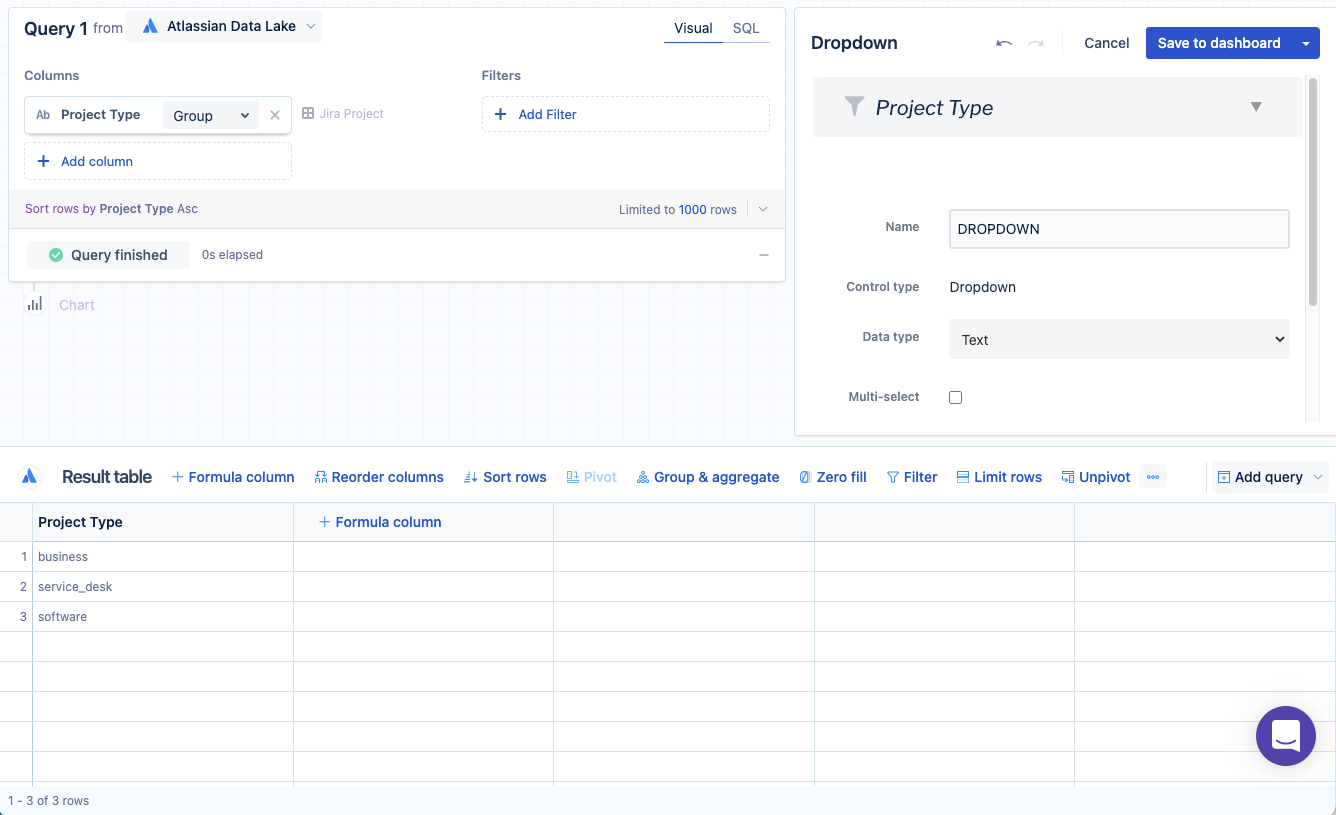
Select Add control from the dashboard left sidebar and then choose “Dropdown” for the control type. Start by building an initial query that groups “Project Type” from the “Jira Project” table.
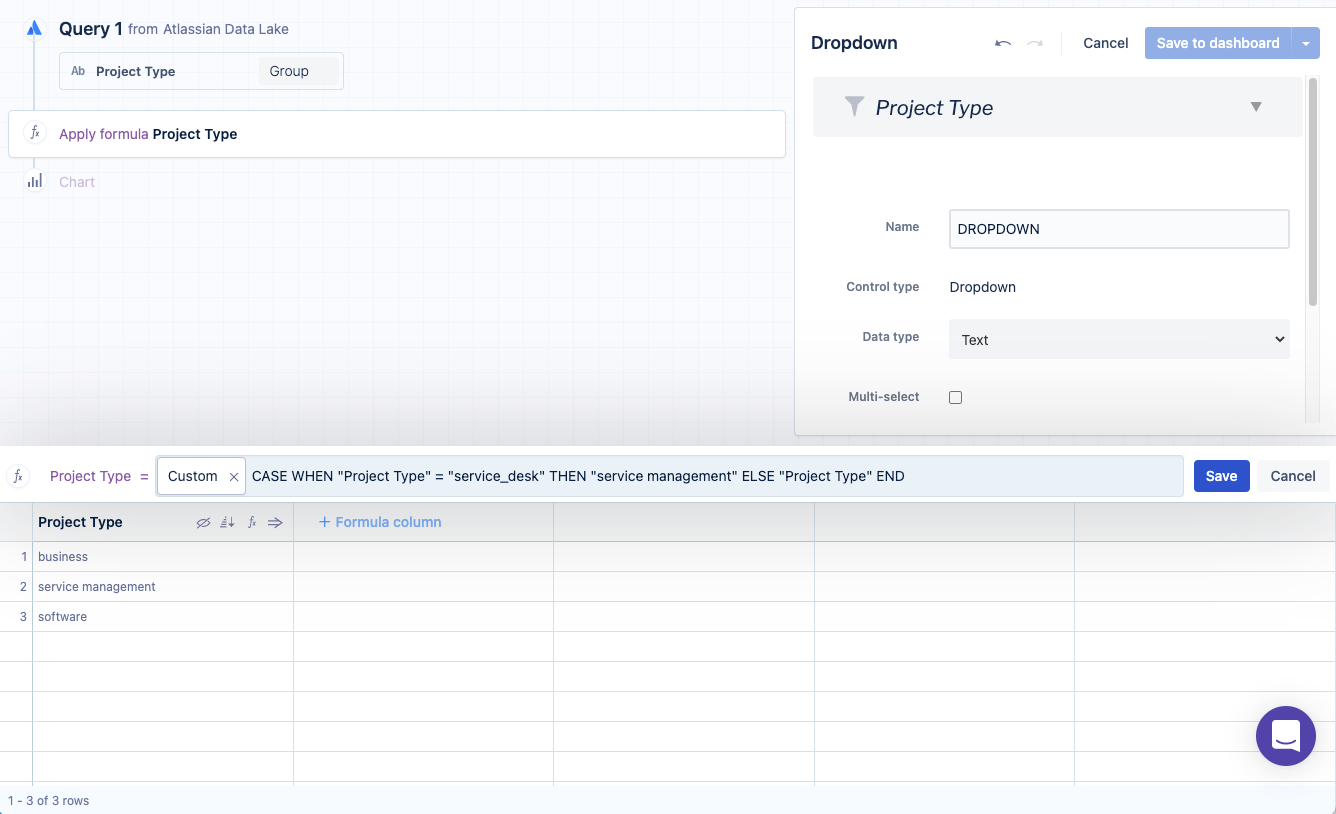
Hover over the “Project Type” column header and select the option to "Apply formula". Choose Custom as the formula type. Use the following
CASEstatement to change all cases of “service_desk” to be visible as “service management”.CASE WHEN "Project Type" = "service_desk" THEN "service management" ELSE "Project Type" ENDSelect Save to apply the formula to the “Project Type” column and then Save to dashboard.
Connect the “Dropdown” control with the custom CASE statement to your chart
As we mentioned in the previous section, you need to update your connected chart’s query to properly filter on your “Dropdown” control if you created it using aCASE statement.
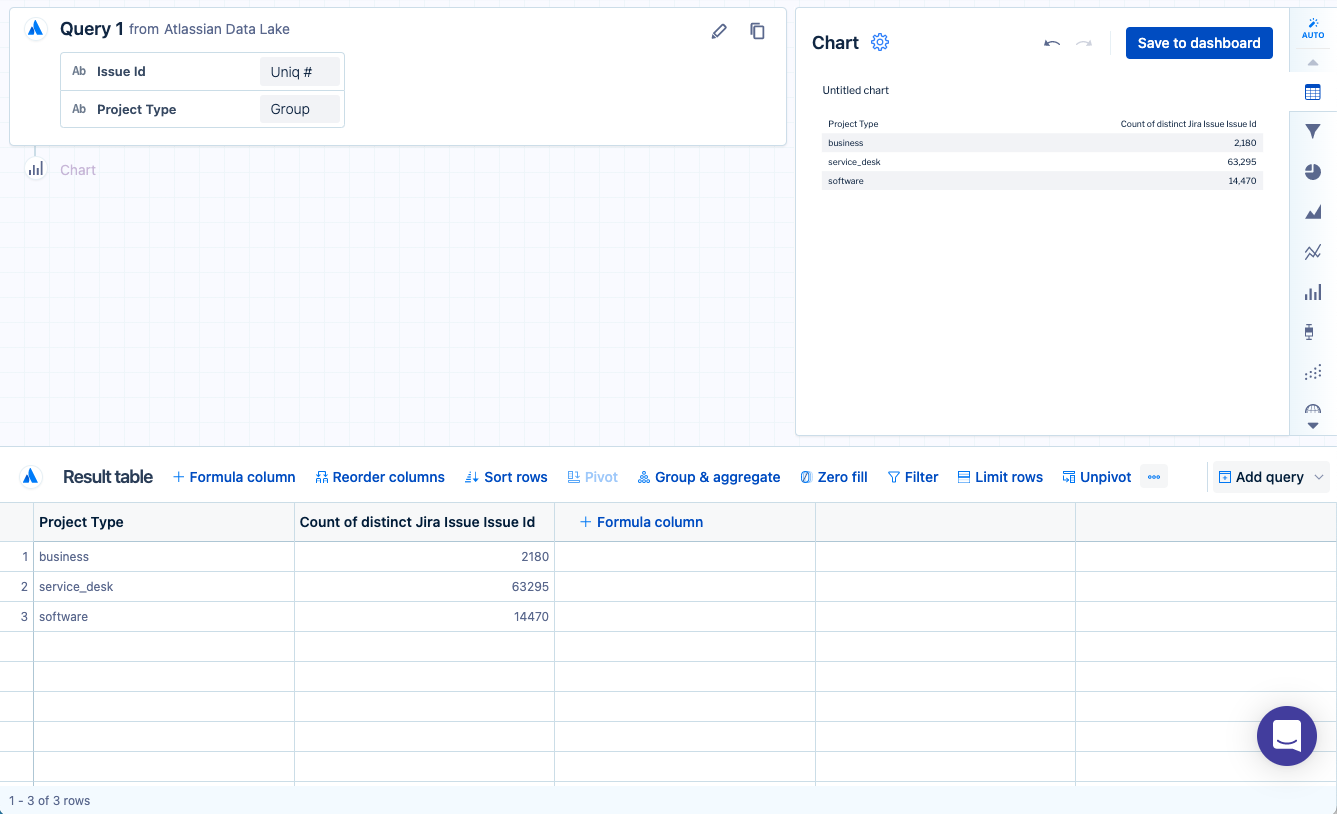
In this example, we have a chart that gives us a count of Jira issues by Jira project type:
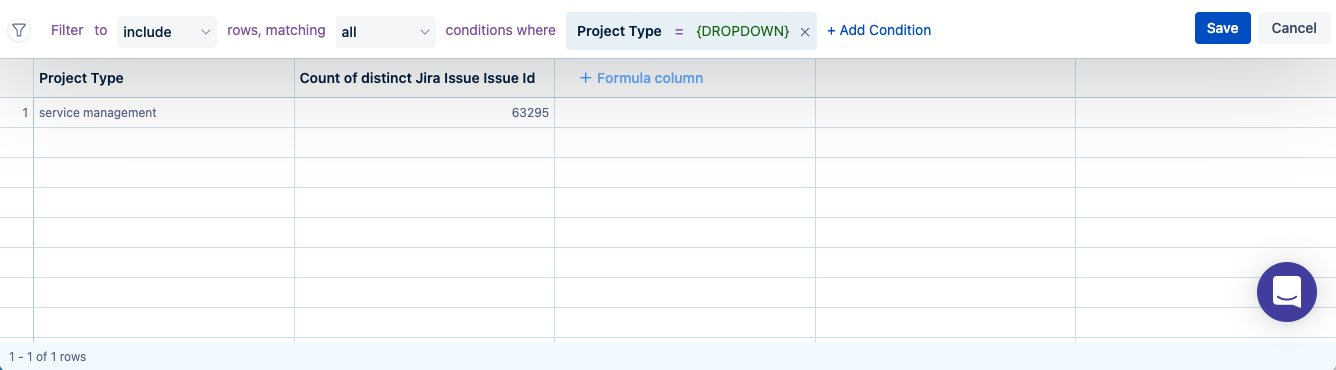
First, we need to apply the same
CASEstatement to the “Project Type” column that we applied to the “Project Type” column in our “Dropdown” control:CASE WHEN "Project Type" = "service_desk" THEN "service management" ELSE "Project Type" END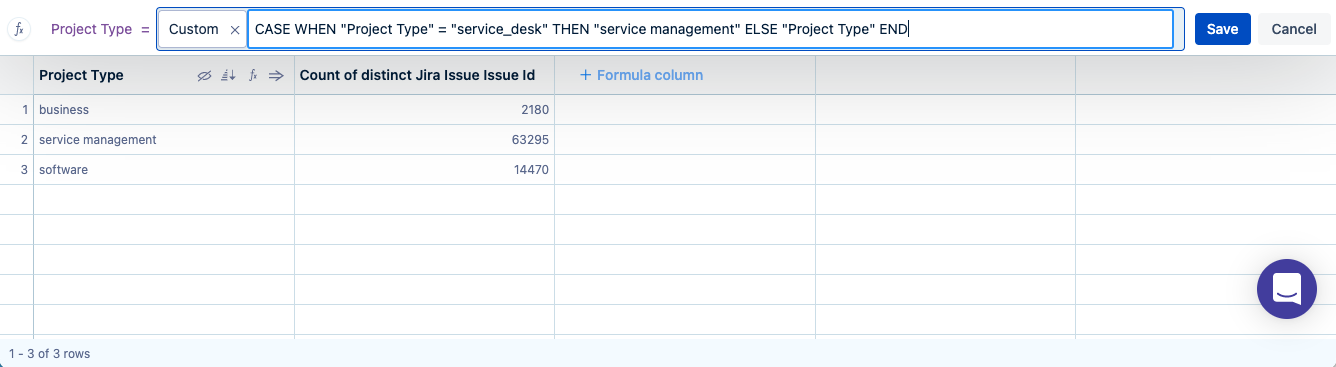
Then we can connect our “Dropdown” control using a “Filter” step:
Select Save to dashboard and you’re done! You can now filter your chart on the custom value that you created using a
CASEstatement in your “Dropdown” control.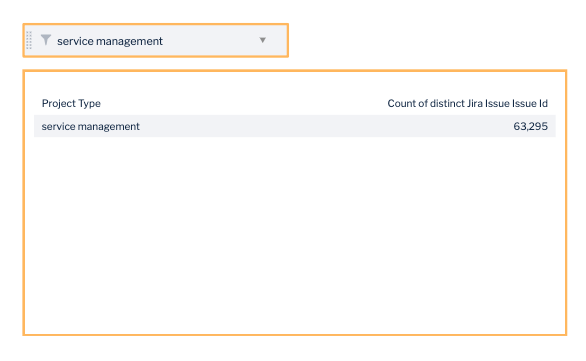
この内容はお役に立ちましたか?