How to monitor Fisheye Crucible using JMX in Linux
Platform Notice: Data Center Only - This article only applies to Atlassian apps on the Data Center platform.
Note that this KB was created for the Data Center version of the product. Data Center KBs for non-Data-Center-specific features may also work for Server versions of the product, however they have not been tested. Support for Server* products ended on February 15th 2024. If you are running a Server product, you can visit the Atlassian Server end of support announcement to review your migration options.
*Except Fisheye and Crucible
Purpose
See real time operating data from your Fisheye/Crucible instance. For example, if you want to determine the number of repositories open in memory monitor the activeCount variable.
Cause
Other variables:
Attribute name: PassivationStats
Values:
Name | Function |
|---|---|
activeCacheSize | Current total size of the cache for all active repos |
activeCount | Total number of active (i.e. in-memory) runnable repositories |
cacheUsage | Fractional usage of the allocated cache |
gcPassivations | Total number of passivations due to GC load |
maxActivePassivations | Current count of passivations due to reaching the active limit |
maxActiveRepos | Maximum number of active repos allowed |
maxCacheSize | Max total heap size allocated to per-repo caches, in bytes |
needingPassivationCacheSize | Current total size of the cache for all close-wait repos |
needingPassivationCount | Total number of active (i.e. in-memory) repositories requiring passivation |
perRepoCacheSize | Current per-repo cache size setting in bytes |
runnableCount | Total number of repositories considered runnable |
What is JMX?
JMX (Java Management eXtensions) is a technology for monitoring and managing Java applications. JMX uses objects called MBeans (Managed Beans) to expose data and resources from your application.
Solution
The JMX interface allows you to see live internal information from your Fisheye/Crucible instance, via the following MBean:
com.atlassian.fisheye.rep.PassivateMXBean
Enable JMX in Fisheye/Crucible
Add the following options to your FISHEYE_OPTSenvironment variable and restart Fisheye/Crucible:
-Dcom.sun.management.jmxremote -Dcom.sun.management.jmxremote.port=8061 -Dcom.sun.management.jmxremote.authenticate=false -Dcom.sun.management.jmxremote.ssl=false -Djava.rmi.server.hostname=<FishEye server FQDN>Using a JMX Client
You need to use a JMX client in order to view the JMX output from Confluence. JConsole is a readily available JMX client that is included with the supported Java Developer Kit (version 5 onwards).
Open JConsole and select Remote Process
Specify the hostname of server and the port that JMX is running on, ie.
fisheyeserver.company.com:8061Click Connect
When prompted, click the Insecure button
Adding live monitoring to a production instance may have an impact on performance.
Enable Jetty JMX MBeans
In case you want to extend the monitoring to Jetty and enable JMX for the Jetty MBeans it is possible to add one extra parameter to the FISHEYE_OPTSenvironment variable to enable that:
-Dfisheye.jetty.jmx.enable=trueThe full content of the FISHEYE_OPTS in this case will be the following:
-Dcom.sun.management.jmxremote -Dcom.sun.management.jmxremote.port=8061 -Dcom.sun.management.jmxremote.authenticate=false -Dcom.sun.management.jmxremote.ssl=false -Djava.rmi.server.hostname=<FishEye server FQDN> -Dfisheye.jetty.jmx.enable=trueIf this option is enabled, at restart, Fisheye/Crucible will show the following extra log line:
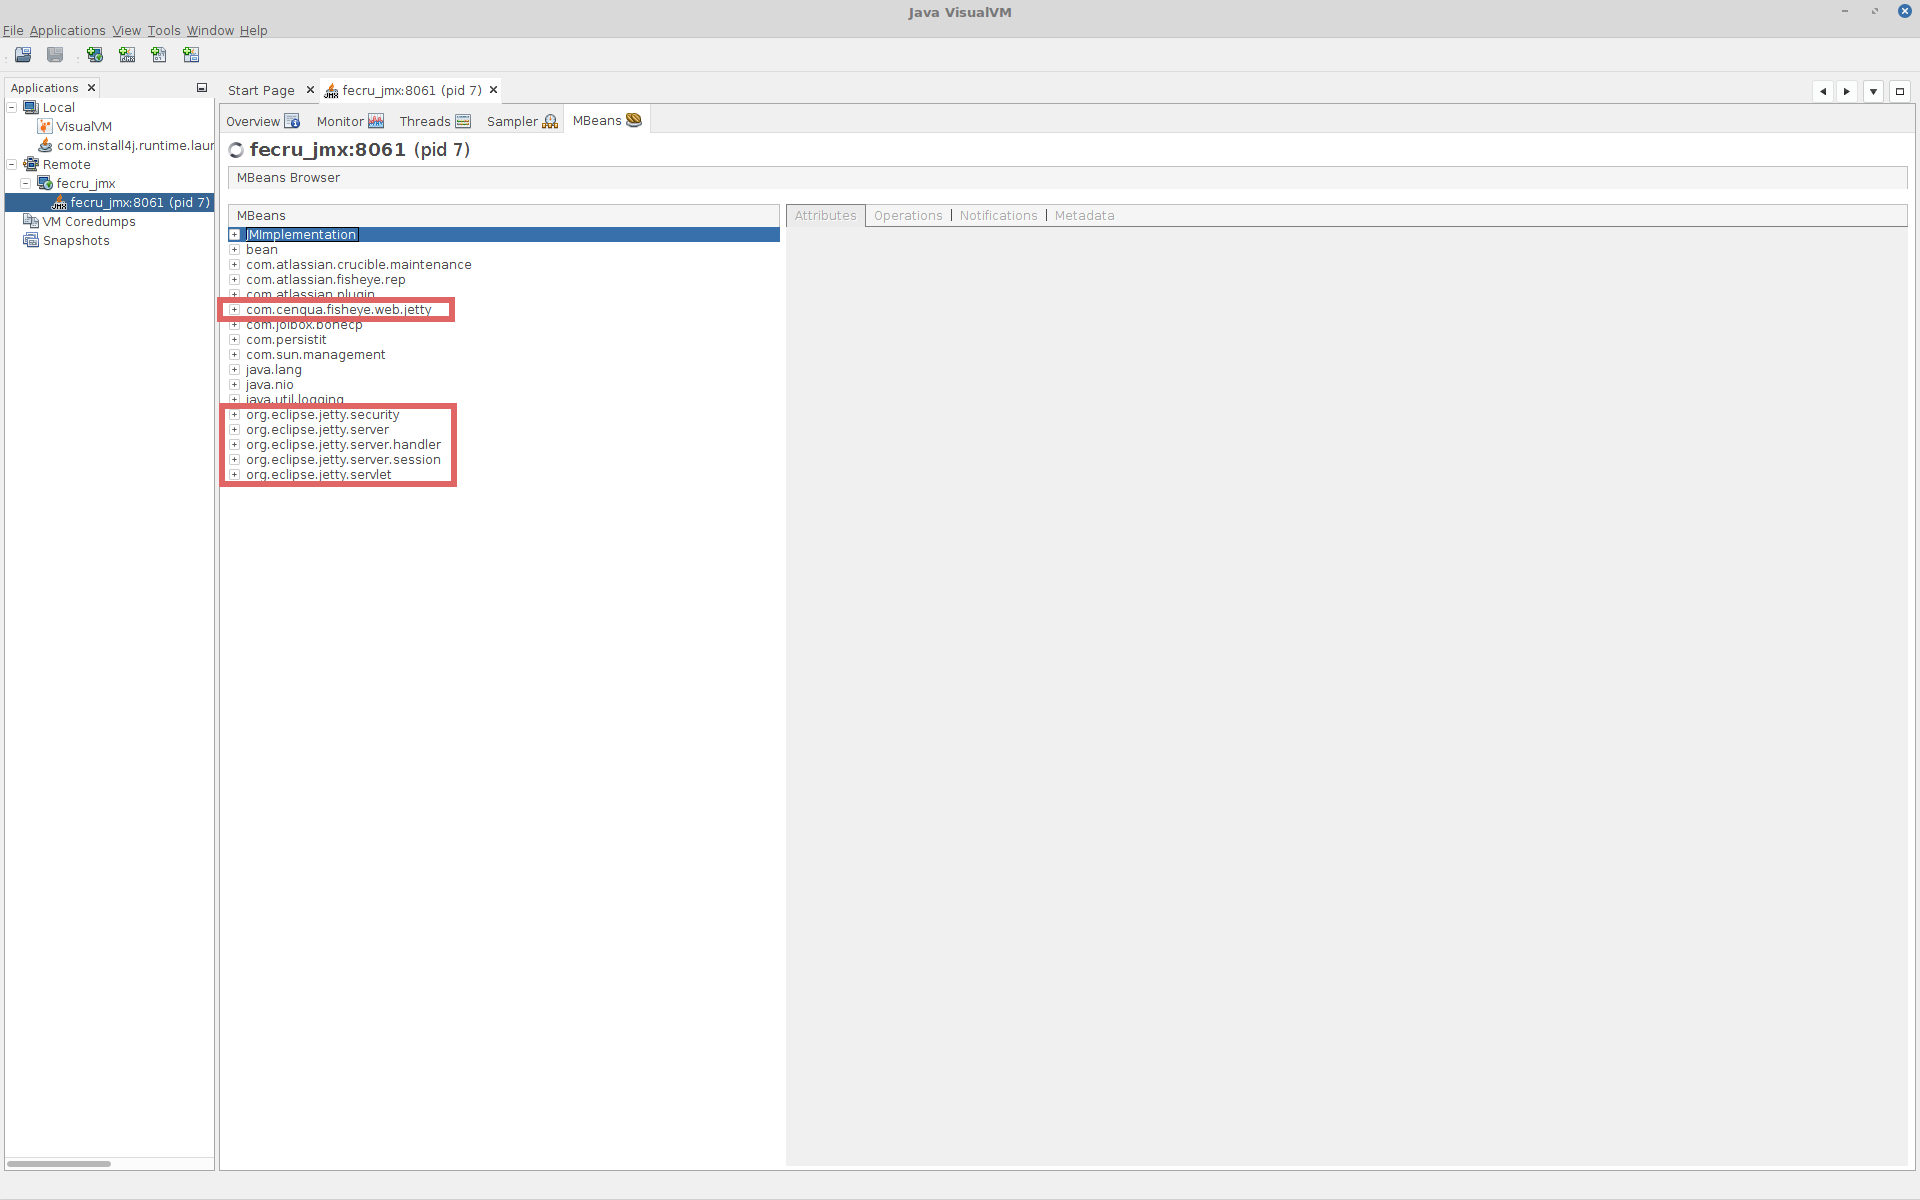
2018-03-12 10:50:02,963 INFO - System property fisheye.jetty.jmx.enable set to value: trueWhen enabled you will see extra MBean available in your JMX client. Below an example of the MBean available on VisualVM:
Was this helpful?