This site is read-only when trying to watch or unwatch a page or space in Confluence
Platform Notice: Data Center Only - This article only applies to Atlassian apps on the Data Center platform.
Note that this KB was created for the Data Center version of the product. Data Center KBs for non-Data-Center-specific features may also work for Server versions of the product, however they have not been tested. Support for Server* products ended on February 15th 2024. If you are running a Server product, you can visit the Atlassian Server end of support announcement to review your migration options.
*Except Fisheye and Crucible
Summary
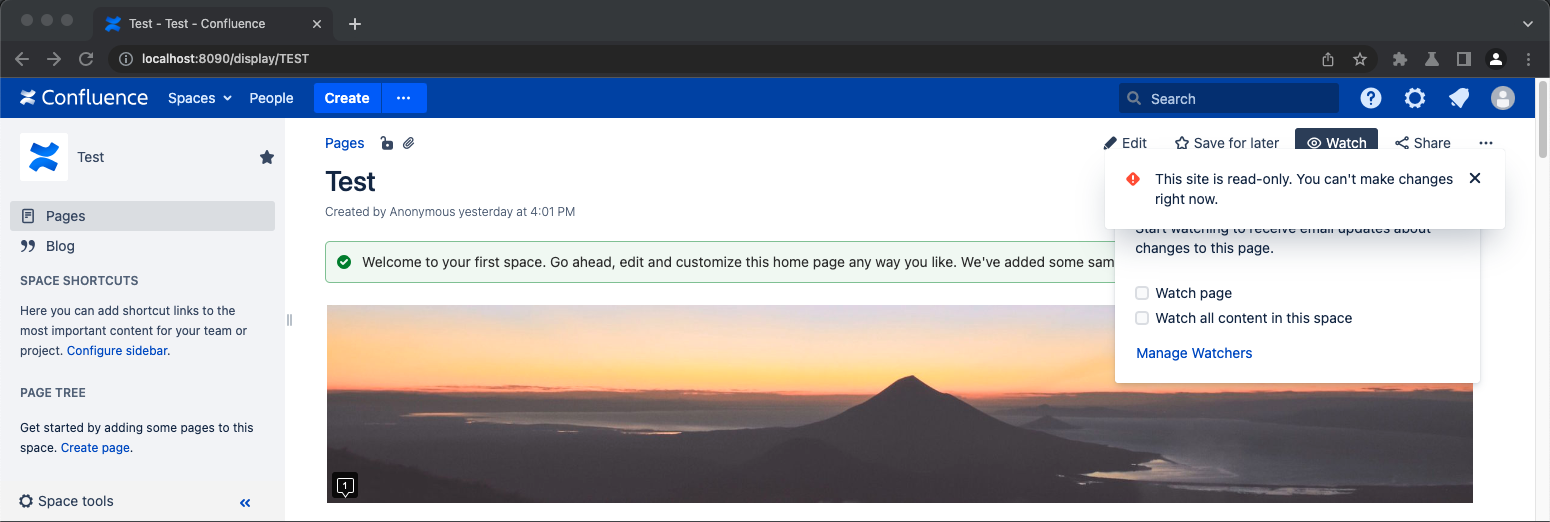
When attempting to either watch or unwatch a page or an entire space, Confluence displays a pop-up message "This site is read-only. You can't make changes right now" .
Diagnosis
First, be sure to rule out common causes of a site being "Read-Only". These common reasons include:
If you are running Confluence Data Center, confirm that Read-only mode is not active in ⚙ >General Configuration > Maintenance. This option does not exist for Confluence Server.
Check if Confluence is using an incorrect or expired license which may send Confluence into Read-Only Mode. The documentation for Managing your Confluence License provides relevant details and you can find your current license at https://my.atlassian.com/.
If you have checked the above two causes, but still found no explanation, the next step would be to capture a HAR file and analyze the requests and responses related to the watch/unwatch actions. We have seen cases where an intermediate appliance such as a web application firewall, proxy, or load balancer detects the watch/unwatch request as potentially malicious and intercepts it. To determine if that is what you are facing, see if your HAR file is consistent with the following expectations:
Action in UI | Request Method | Location | Expected HTTP Response Code | Expected HTTP Response Content |
|---|---|---|---|---|
Page Watch | POST | http://localhost:8090/rest/api/user/watch/content/<CONTENT-ID> | HTTP 200 | Example JSON Response Content: { "type": "content-watch", "watcher": { "type": "user", "userKey": "ff80808188b657430188b65830c10000" }, "content": { "id": "393229", "status": "current", "links": {}, "space": null, "history": null, "version": null, "ancestors": [], "operations": [], "children": {}, "descendants": {}, "container": null, "body": {}, "metadata": {}, "extensions": {}, "restrictions": {} } } |
Page Unwatch | DELETE | http://localhost:8090/rest/api/user/watch/content/<CONTENT-ID> | HTTP 204 | The response content should be empty.⚠️ |
Space Watch | POST | http://localhost:8090/rest/api/user/watch/space/<SPACE-NAME> | HTTP 200 | Example JSON Response Content: { "type": "space-watch", "watcher": { "type": "user", "userKey": "ff80808188b657430188b65830c10000" }, "space": { "key": "TEST", "icon": null, "description": null, "homepage": null, "links": {}, "type": "global", "metadata": {}, "retentionPolicy": null }, "contentTypes": [] } |
Space Unwatch | DELETE | http://localhost:8090/rest/api/user/watch/space/<SPACE-NAME> | HTTP 204 | The response content should be empty.⚠️ |
Solution
If you find any inconsistencies, you can check internally with your teams to see if there is such a network appliance which might be causing this issue. Sometimes checking into the response content of these requests can provide some clues. If you have any questions, feel free to reach out to Atlassian Support with Support Zip and your HAR file and we will see if there is any additional information we can share within the scope of the Atlassian Support Offerings.
Was this helpful?