Site Content Indexing page stuck on "In Progress" or "Propagating index" status after triggering a reindex task in Confluence Data Center
Platform Notice: Data Center Only - This article only applies to Atlassian apps on the Data Center platform.
Note that this KB was created for the Data Center version of the product. Data Center KBs for non-Data-Center-specific features may also work for Server versions of the product, however they have not been tested. Support for Server* products ended on February 15th 2024. If you are running a Server product, you can visit the Atlassian Server end of support announcement to review your migration options.
*Except Fisheye and Crucible
Summary
After triggering a site reindex the UI gets stuck on "In Progress" and never finishes.
While "In Progress" it's not possible to trigger another reindex.
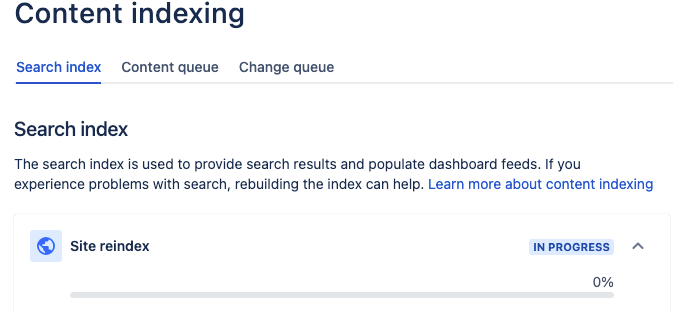
.
Cause
This issue appears to happen when there is some inconsistency in the reindex.status field in the bandana table.
The status inconsistency can be caused by many factors, for example:
When restoring the database from another cluster, or;
When there is an issue propagating the index snapshot;
Diagnosis
✔️ Entries on the reindex starting and finishing up can be seen in the atlassian-confluence-index.log
2024-06-19 21:56:00,108 INFO [Indexer: 1] [confluence.internal.index.ConcurrentBatchIndexer] logProgress Re-index progress: 100% complete. 3198700 items have been reindexed
2024-06-19 21:56:00,109 INFO [lucene-interactive-reindexing-thread] [confluence.internal.index.ConcurrentBatchIndexer] index Shutting down indexing thread pool
2024-06-19 21:56:00,109 INFO [lucene-interactive-reindexing-thread] [internal.index.lucene.LuceneReIndexer] lambda$reIndex$7 full reindex group 1/1 completed for USER_ONLY, 100% complete
2024-06-19 21:56:00,109 INFO [lucene-interactive-reindexing-thread] [internal.index.lucene.LuceneReIndexer] lambda$reIndex$7 full reindex completed for USER_ONLY, 100% complete, start cleaning up files
2024-06-19 21:56:00,109 INFO [lucene-interactive-reindexing-thread] [internal.index.lucene.LuceneReIndexer] lambda$reIndex$7 Post-optimizing indices...
2024-06-19 21:56:01,538 INFO [lucene-interactive-reindexing-thread] [internal.index.lucene.LuceneReIndexer] lambda$reIndex$7 full reindex cleanup completed for USER_ONLY
2024-06-19 21:56:01,555 INFO [lucene-interactive-reindexing-thread] [internal.index.lucene.LuceneReIndexer] lambda$setJournalsLatestEntries$10 main_index storage was set to the latest entry 49746351
2024-06-19 21:56:01,555 INFO [lucene-interactive-reindexing-thread] [internal.index.lucene.LuceneReIndexer] lambda$setJournalsLatestEntries$10 edge_index storage was set to the latest entry 49743405
2024-06-19 21:56:01,555 INFO [lucene-interactive-reindexing-thread] [internal.index.lucene.LuceneReIndexer] lambda$setJournalsLatestEntries$10 change_index storage was set to the latest entry 49746346
2024-06-19 21:56:01,555 INFO [lucene-interactive-reindexing-thread] [internal.index.lucene.LuceneReIndexer] reIndex Indexing completed for stage USER_ONLY
2024-06-19 21:56:09,901 INFO [Caesium-1-1] [index.lucene.snapshot.DefaultLuceneIndexSnapshotManager] create Creating a new snapshot for index main_index
2024-06-19 22:12:07,083 INFO [Caesium-1-1] [index.lucene.snapshot.DefaultLuceneIndexSnapshotManager] create A new snapshot has been created for index main_index with journalEntryId of 49746352
2024-06-19 22:12:07,755 INFO [Caesium-1-1] [index.lucene.snapshot.DefaultLuceneIndexSnapshotManager] create Creating a new snapshot for index change_index
2024-06-19 22:13:02,388 INFO [Caesium-1-1] [index.lucene.snapshot.DefaultLuceneIndexSnapshotManager] create A new snapshot has been created for index change_index with journalEntryId of 49746353
✔️ An entry on the Index snapshot being created and propagated to all nodes can be then seen on the atlassian-confluence.log file
2024-06-19 22:13:12,371 INFO [Caesium-1-3] [impl.system.runner.RestoreIndexSnapshotMaintenanceTaskRunner] doRestore Restoring index snapshots
2024-06-19 22:15:25,949 INFO [Caesium-1-3] [impl.system.runner.RestoreIndexSnapshotMaintenanceTaskRunner] doRestore Index snapshot IndexSnapshot[JournalId=main_index, JournalEntryId=49746352] has been restored
2024-06-19 22:15:35,037 INFO [Caesium-1-3] [impl.system.runner.RestoreIndexSnapshotMaintenanceTaskRunner] doRestore Index snapshot IndexSnapshot[JournalId=change_index, JournalEntryId=49746353] has been restored
2024-06-19 22:15:35,037 INFO [Caesium-1-3] [impl.system.runner.RestoreIndexSnapshotMaintenanceTaskRunner] doRestore All index snapshots have been restored successfully
Even though the logs show that the reindexing process has finished, whether successfully or not, the reindex status is still showing "In Progress" in the UI.
To query the status of the reindex at the database level, we can run the query below in the database:
select bandanavalue from bandana where bandanakey = 'reindex.status'; The example below shows the reindex status being stuck on UNAVAILABLE/PROPAGATING on a few nodes, which the logs show as not being the case. This leads the UI to get stuck on the "In Progress." status
Output example
bandanavalue
"<com.atlassian.confluence.index.status.ReIndexJob>
  <id>32dds343-5472-sds3-8ad2-3423423423de</id>
  <startTime>2024-06-19T17:39:42.983770Z</startTime>
  <stage>PROPAGATING</stage>
  <acknowledged>false</acknowledged>
  <rebuildingProgress>
    <total>3198697</total>
    <processed>3198697</processed>
  </rebuildingProgress>
  <lastRebuildingUpdate>2024-06-19T21:56:01.406481Z</lastRebuildingUpdate>
  <nodeStatuses class=""list"">
    <com.atlassian.confluence.index.status.ReIndexNodeStatus>
      <nodeId>...</nodeId>
      <state>UNAVAILABLE</state>
      <error>UNAVAILABLE</error>
      <progress>
        <total>0</total>
        <processed>0</processed>
      </progress>
    </com.atlassian.confluence.index.status.ReIndexNodeStatus>
...
    <com.atlassian.confluence.index.status.ReIndexNodeStatus>
      <nodeId>...</nodeId>
      <state>PROPAGATING</state>
      <progress>
        <total>0</total>
        <processed>0</processed>
      </progress>
    </com.atlassian.confluence.index.status.ReIndexNodeStatus>
...
    <com.atlassian.confluence.index.status.ReIndexNodeStatus>
      <nodeId>...</nodeId>
      <state>PROPAGATING</state>
      <progress>
        <total>0</total>
        <processed>0</processed>
      </progress>
    </com.atlassian.confluence.index.status.ReIndexNodeStatus>
  </nodeStatuses>
  <createdBy class=""com.atlassian.confluence.user.ConfluenceUserImpl"">
...
  </createdBy>
  <spaceKeys/>
</com.atlassian.confluence.index.status.ReIndexJob>"
Solution
To have the UI status information reflecting the correct reindexing status, it'll be necessary to delete the reindex.status value from the bandana table, as per the steps below:
Always back up your data before making any database modifications. If possible, test any alter, insert, update, or delete SQL commands on a staging server first. Note that certain directory-related corrections might require stopping Jira to avoid further inconsistencies or data loss, and no alternatives for avoiding downtime currently exist.
Stop Confluence.
Delete the status from the database with:
DELETE FROM BANDANA WHERE BANDANAKEY='reindex.status';Start Confluence.
Start a new reindex if needed.
Was this helpful?