Confluence Uses More Memory Than The Total Allocated Memory in System Information Screen
Platform Notice: Data Center Only - This article only applies to Atlassian apps on the Data Center platform.
Note that this KB was created for the Data Center version of the product. Data Center KBs for non-Data-Center-specific features may also work for Server versions of the product, however they have not been tested. Support for Server* products ended on February 15th 2024. If you are running a Server product, you can visit the Atlassian Server end of support announcement to review your migration options.
*Except Fisheye and Crucible
Summary
Problem
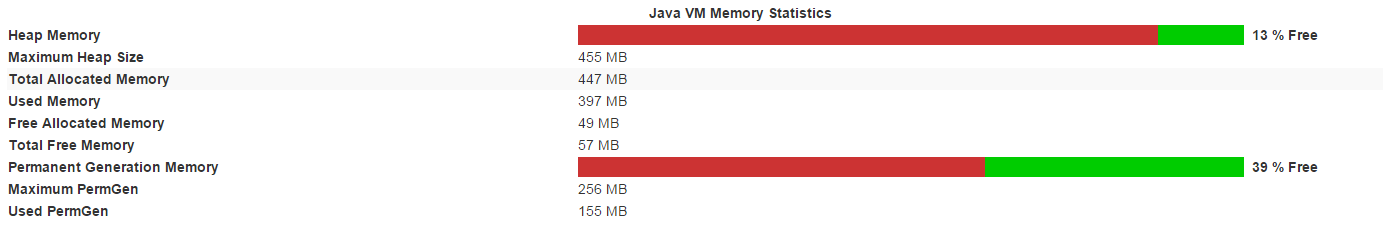
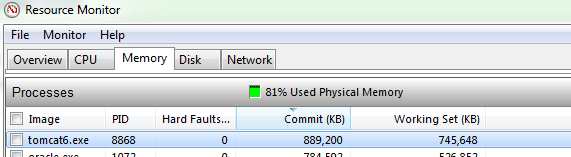
Confluence shows a number in the "Total Allocated Memory" of System Information screen that is lower than the number shown in the server's resource monitor for the Confluence instance itself.
When making the following actions...
Go to
Confluence Admin >> System InformationCheck the Total Allocated Memory
Go to the Confluence server's resource monitor
Diagnosis
Try to restart the Confluence instance to see if the figure changes
Cause
The number shown in the resource monitor is usually the sum of "Maximum Heap Size", "Maximum PermGen" and other variables that shouldn't be more than PermGen size.
Solution
Workaround
The number shown in the resource monitor can be tuned by modifying the -Xms, -Xmx and -XX:MaxPermSize parameters in Confluence System Properties (see Configuring System Properties).
For more information about how to tune Confluence's memory, see Performance Tuning documentation.
Was this helpful?