Few JMX Metrics Available in Staging
Platform Notice: Data Center Only - This article only applies to Atlassian apps on the Data Center platform.
Note that this KB was created for the Data Center version of the product. Data Center KBs for non-Data-Center-specific features may also work for Server versions of the product, however they have not been tested. Support for Server* products ended on February 15th 2024. If you are running a Server product, you can visit the Atlassian Server end of support announcement to review your migration options.
*Except Fisheye and Crucible
Summary
Problem
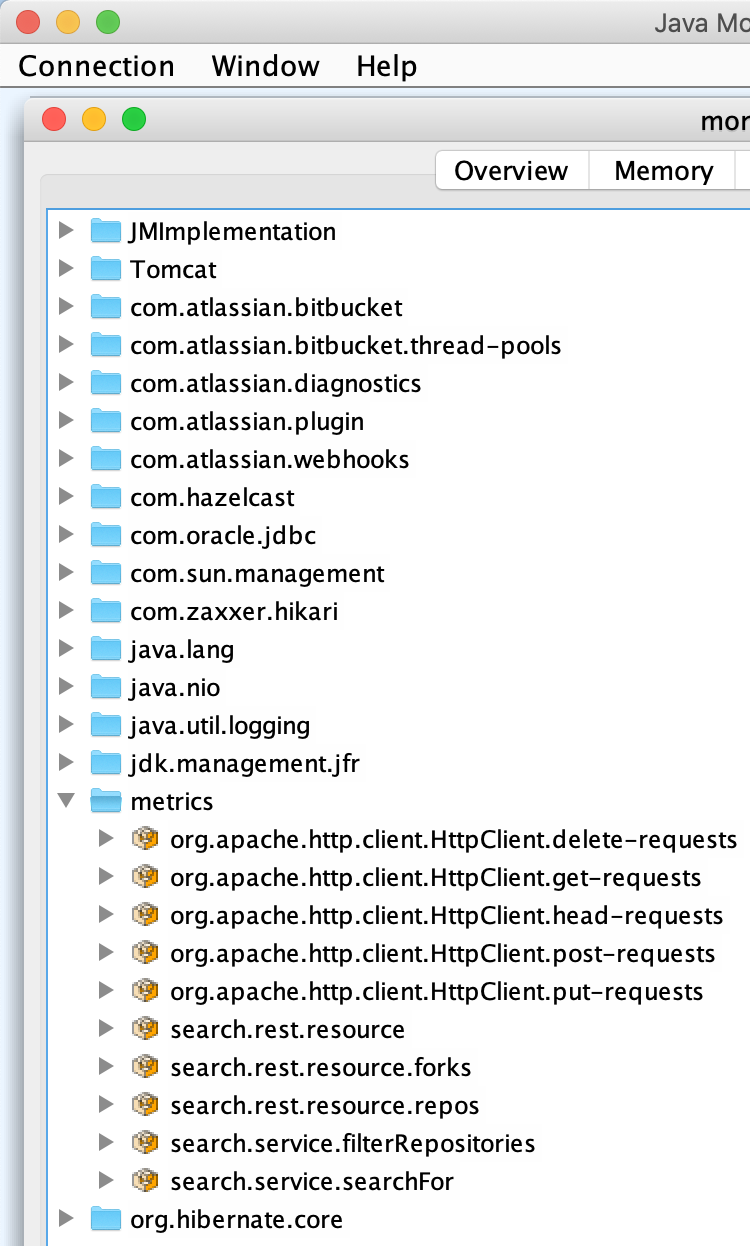
You keep monitoring the JMX metrics in your Production instance of Bitbucket Server or Data Center and you are used to seeing a number of JMX metrics available in your instance. When you start jconsole and connect to your Bitbucket Server, switch to the MBeans tab and expand metrics, you may see the following:
You set up a separate Staging environment, where Bitbucket Server is also running, although with much less user activity.
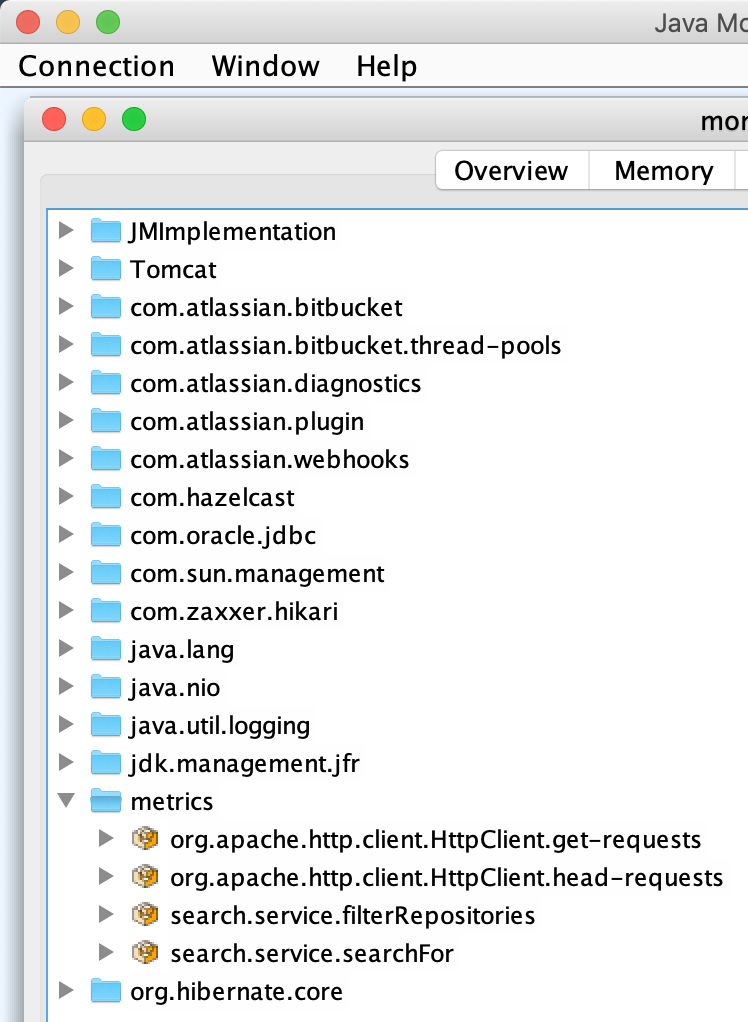
You start jconsole and connect to the Bitbucket Server in Staging, and you notice that only a few of the usual metrics are present - for example:
Diagnosis
Environment
Any Staging deployment with little to no user activity.
Diagnostic Steps
Start Bitbucket Server with JMX enabled, then immediately run
jconsole, connect to your Bitbucket Server in Staging, switch to the MBeans tab and expand:metrics
Cause
These metrics only get initialised on the first use. For example, until the Bitbucket Server receives the first http POST request, the metric: org.apache.http.client.HttpClient.post-requests is not listed as available.
Solution
Resolution
This is working as expected. Once Bitbucket Server is fully initialised and the users generate activity, the corresponding metrics will start appearing in jconsole.
For example:
While Bitbucket Server is still starting up, you may see only 2 metrics
Once it is fully started, and a user logs in, and performs some basic navigation, 4 metrics may be available
Once a new Project is created and deleted, 6 metrics should be available
After a user performs some code search, 10 metrics should be available
Was this helpful?