View performance insights
Platform Notice: Cloud Only - This article only applies to Atlassian apps on the cloud platform.
Summary
Your automation performance insights provide an overall view of how your rules are performing, allowing you to view execution counts, and how long your rules are taking.
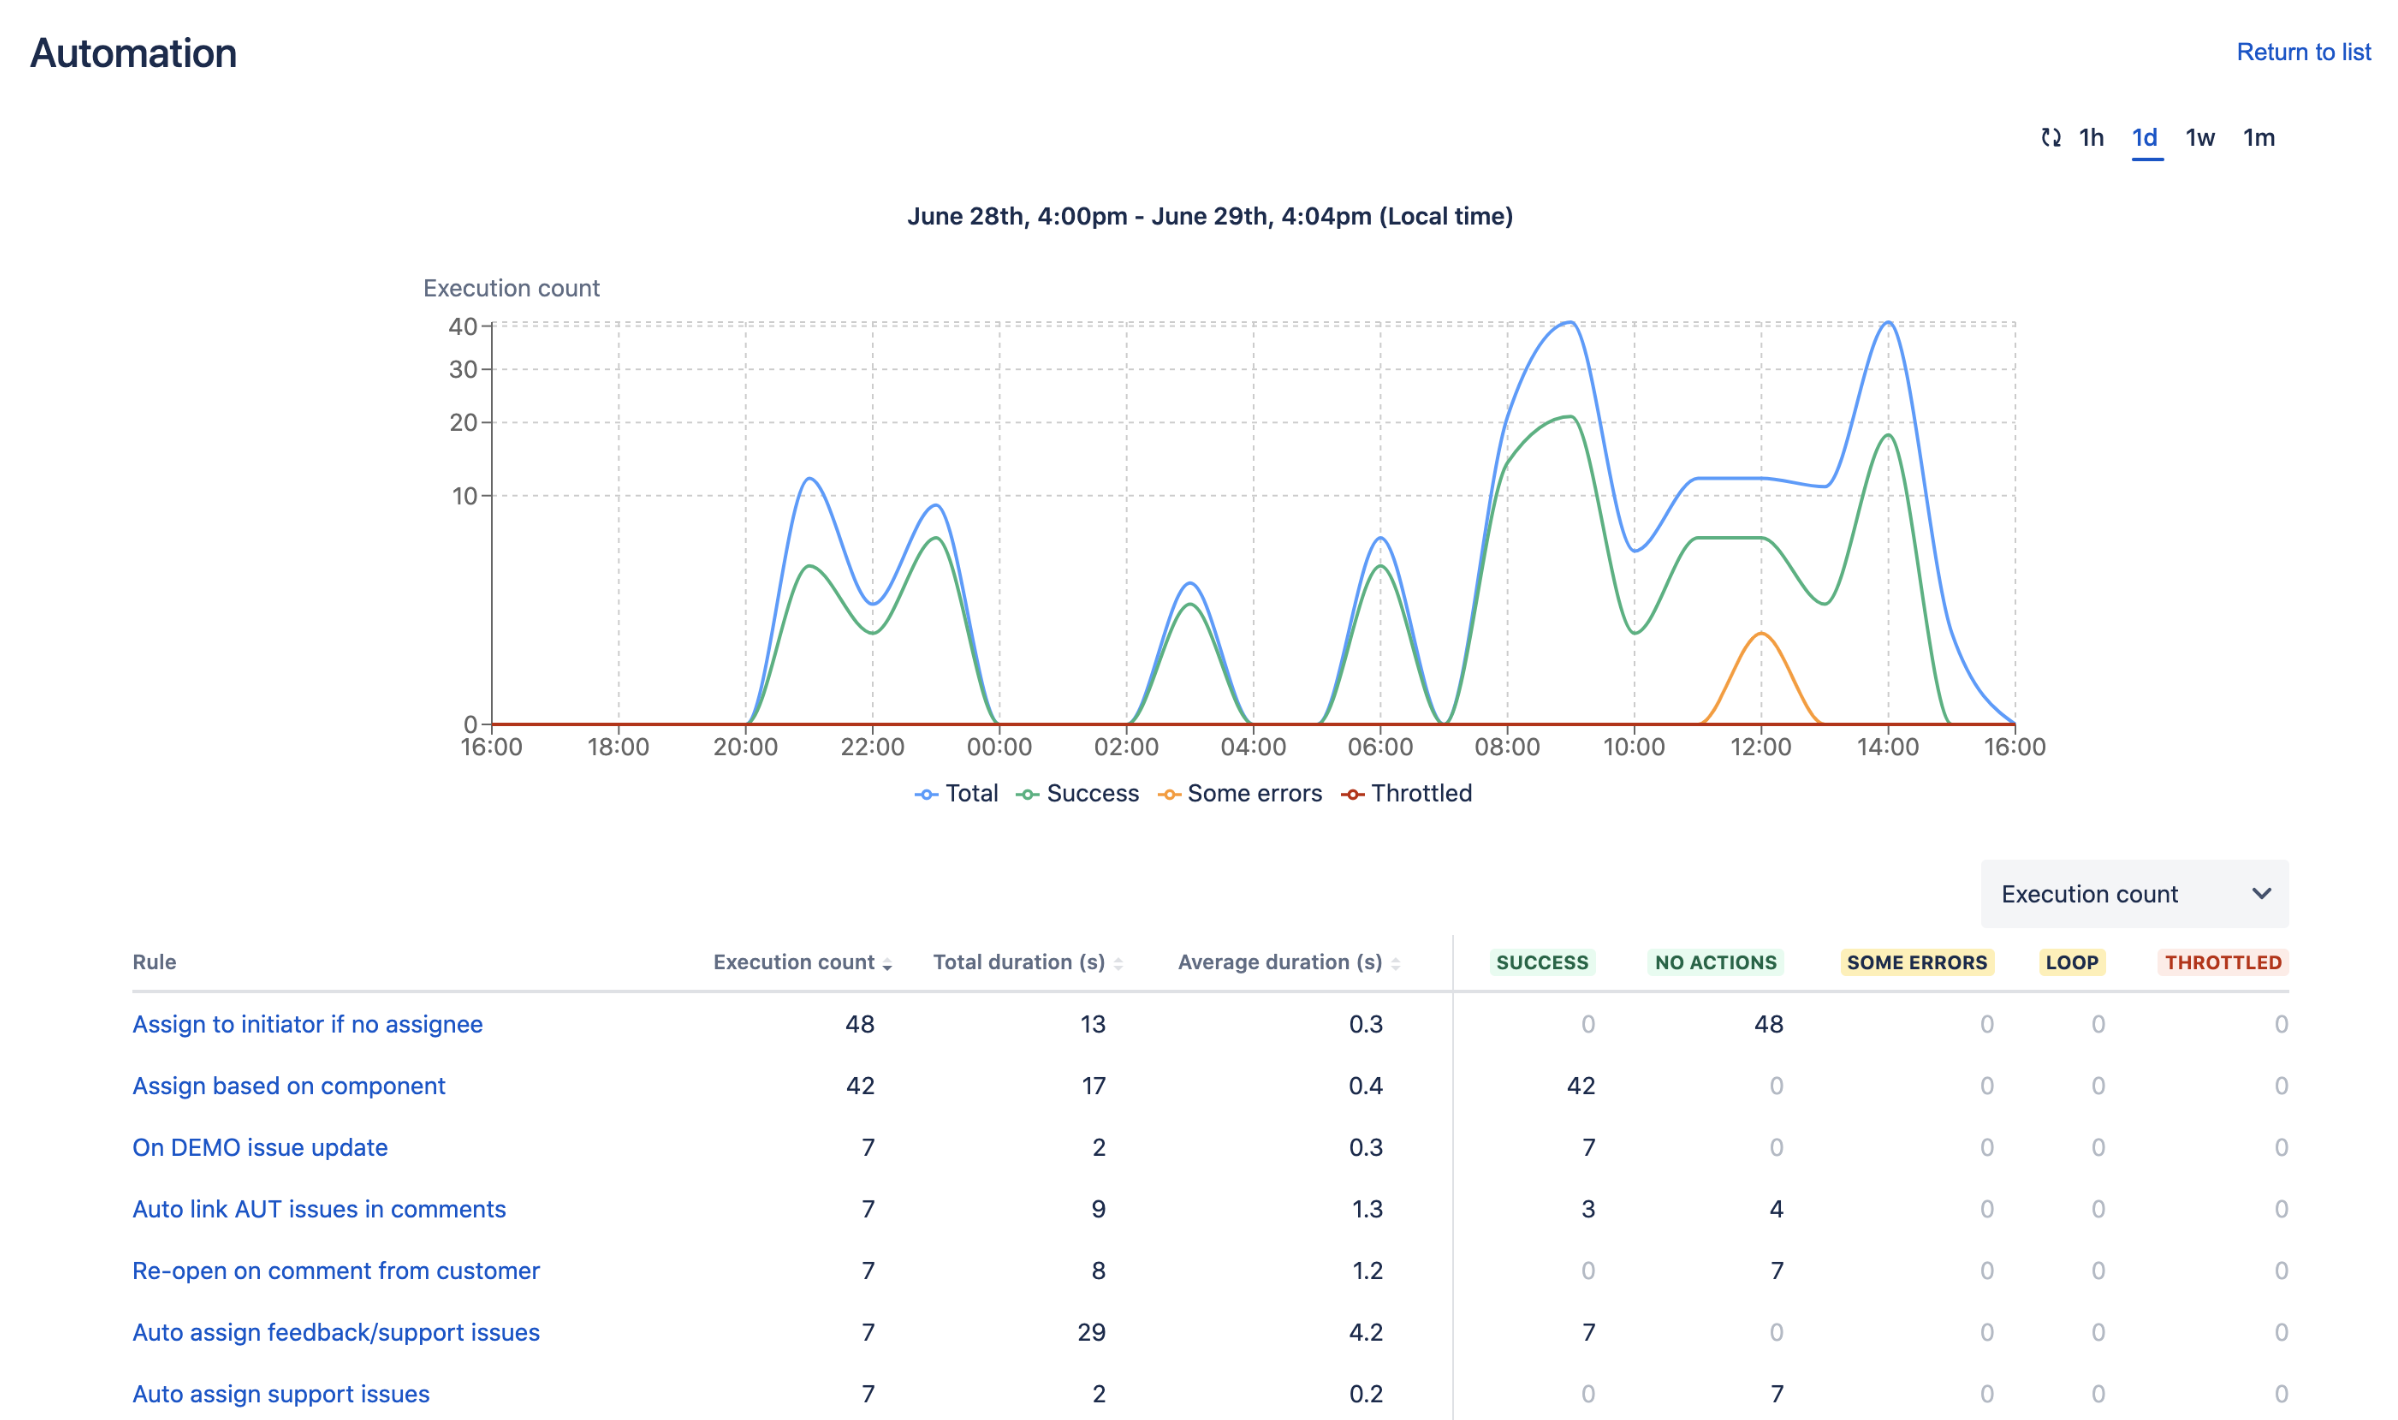
For each rule execution, you can view performance insights for:
Execution count
Average duration in seconds
Total duration in seconds
Each performance metric is broken down by whether your rules were:
Successful: the rule performed an action
No action: the rule executed but no action was performed
Some errors: the rule resulted in an error
Loop: the rule execution resulted in an execution loop
Throttled: the rule breached a service limit
Solution
Viewing automation performance insights
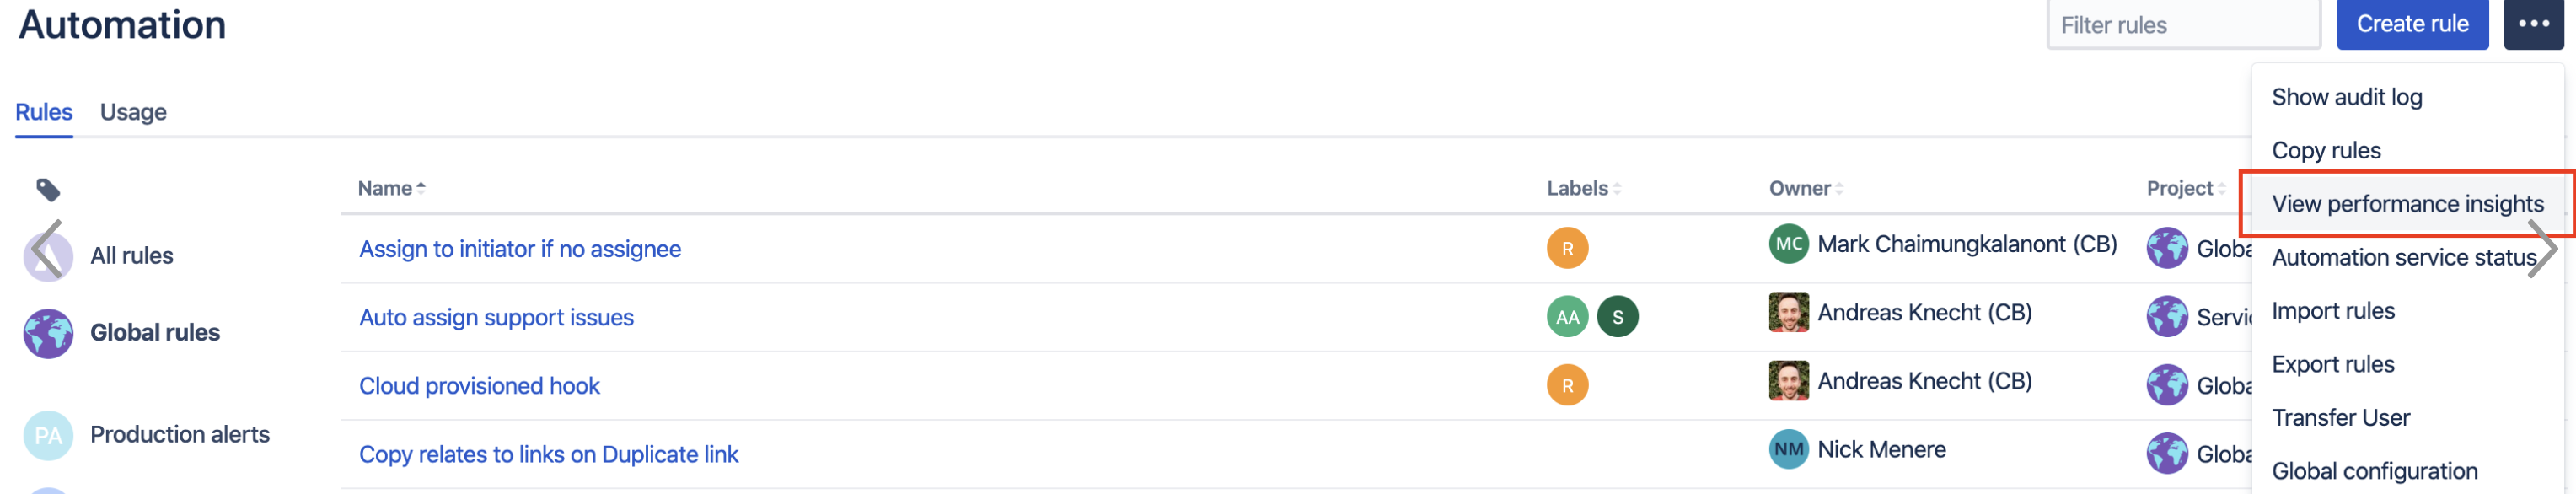
To view performance insights for a project:
Go to the rule list of the project you want to view insights for.
Select more (•••) > View performance insights.

To view performance insights for all projects in your instance:
Go to the automation space in your global administration settings.
Select more (•••) > View performance insights.
Was this helpful?