Navigating Audit Logs in Jira Data Center Automation
Platform Notice: Data Center Only - This article only applies to Atlassian apps on the Data Center platform.
Note that this KB was created for the Data Center version of the product. Data Center KBs for non-Data-Center-specific features may also work for Server versions of the product, however they have not been tested. Support for Server* products ended on February 15th 2024. If you are running a Server product, you can visit the Atlassian Server end of support announcement to review your migration options.
*Except Fisheye and Crucible
Summary
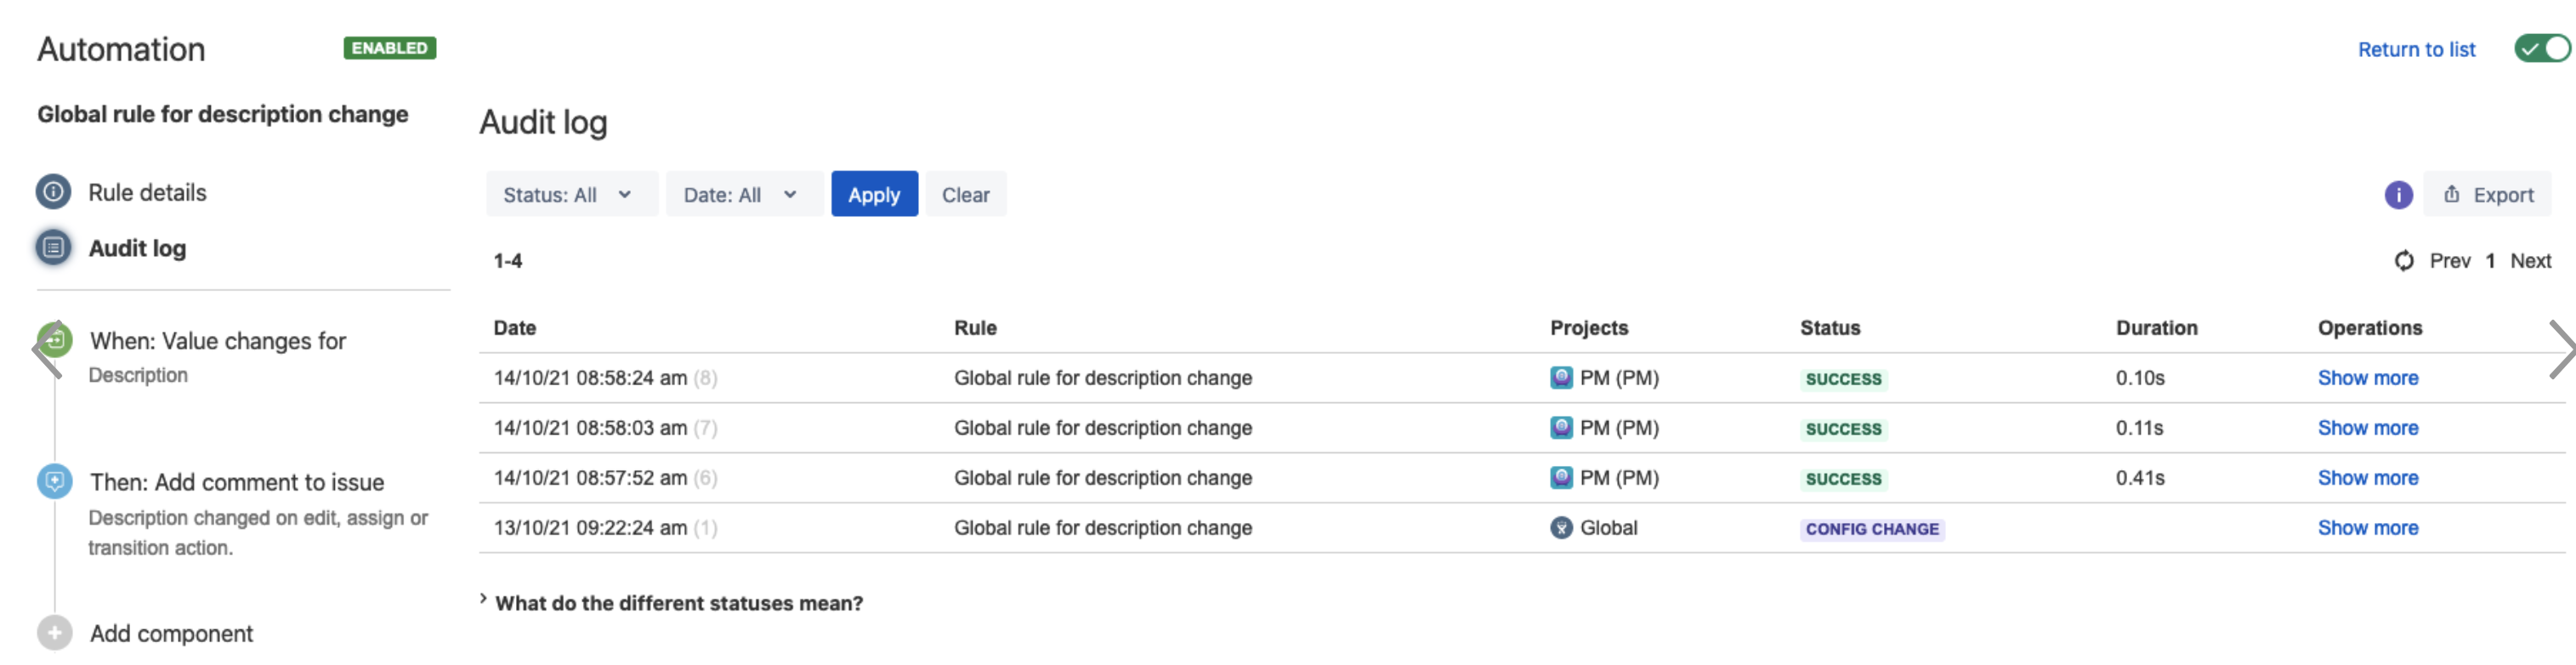
You can use the audit log to check the history of execution of specific rules, either in the context of your project or the entire Jira instance. Every rule has a separate audit log – you can view it in the details of your rule.
Solution
View the audit log
View the project’s audit log
In project settings, go to Project automation.
Select … > Show audit log.
Open one of your rules and then switch to Audit log. This audit log will only show entries related to this project.
View the global audit log
Go to Administration > System > Automation rules (under Automation for Jira). You can also access this page by clicking Global administration in Automation for Jira.
Open one of your rules and then switch to Audit log.
Filter audit log entries
Audit logs can include many historical entries, but you can use the filters to narrow them down. You can filter either by status (the result of executing a rule) or date range. Using the filters is especially important if you plan to export your audit log – there are some limitations as to what you can export.

Export audit log entries
You can export your audit log to JSON. Since audit logs can grow quite quickly, there are some limitations on how many entries you can export.
You can export up to 30,000 entries, but they must be processed within 60 seconds of starting the export. After this time, the export is stopped to avoid performance issues with large audit logs.
Unless you use the status filter, the export can contain entries from 7 days. We generally count the days since the end date you specify in the date filter. If you don’t use this filter, the end date is the current time.
If you use the status filter, the 7-day limit won’t be applied, so you can export all entries with a specific status.
To export the audit log:
Open the audit log for a rule.
Use the status and date filters to narrow down the list of results.
Select Export.
Expire audit log entries
On large instances, many audit logs can build up over time, impacting your Jira database performance and clogging up your disk space. You can configure your audit log to delete such entries regularly. For more info, see Expire audit log items.
Was this helpful?